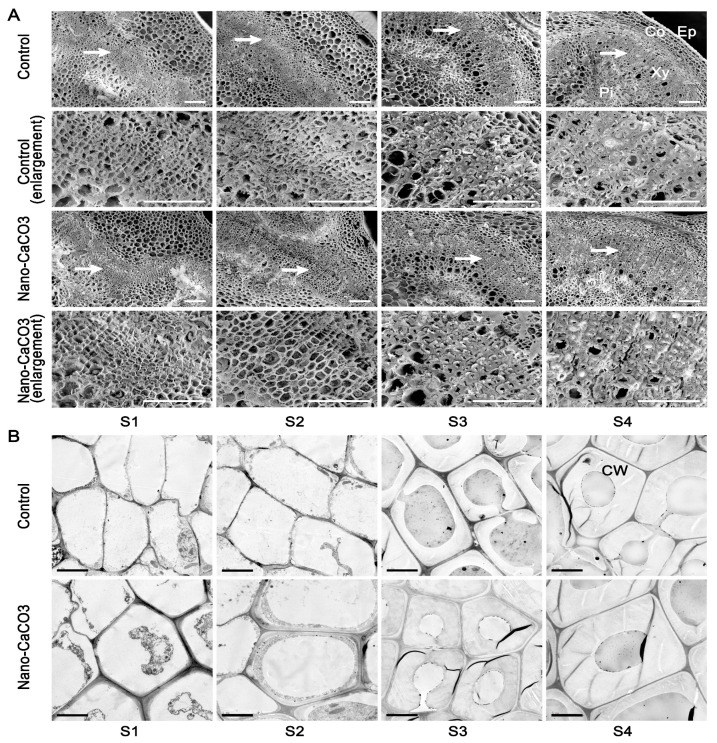
Figure 7.
Effects of nano-CaCO3 treatment on the microstructures of P. lactiflora inflorescence stems at four developmental stages. (A) SEM. Sections of inflorescence stem in Control and nano-CaCO3 treatment. Micrographs of partial enlargement of regions are marked by the arrow. Ep, epidermis; Co, cortex; Pi, pith; Xy, xylem. Bars, 100 µm. (B) TEM. Sections of inflorescence stem in Control and nano-CaCO3 treatment. CW, cell wall. Bars, 5 µm. S1, flower-bud stage; S2, pigmented stage; S3, unfold-petal stage; S4, full-flowering stage.

