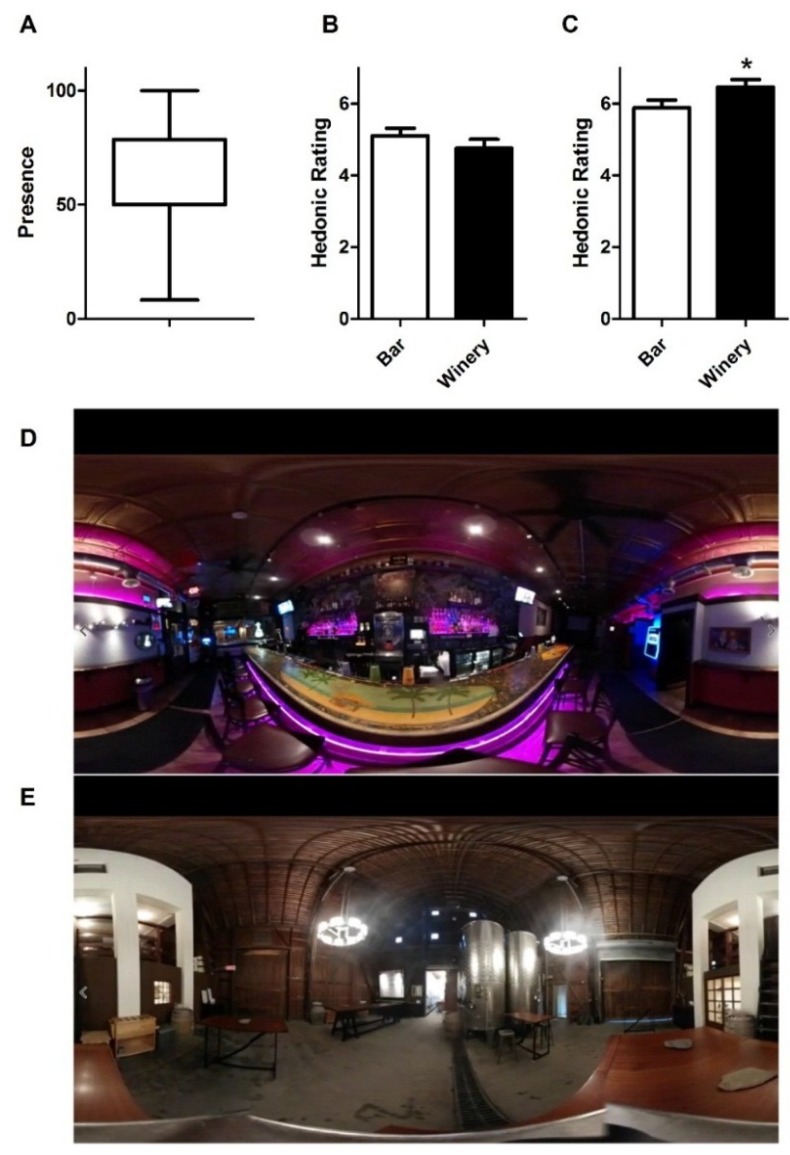
Figure 2.
(A) Panelists’ feelings of immersion were rated from “not present at all” (0) to “completely present” (100). The box and whisker plot denotes mean of 54 and range (standard dev. = 22). (B) Liking for beer was higher, although not significantly, in the bar context (white bar) than the winery (black bar), plus standard error. Samples were rated on a 9-point hedonic scale, with labels indicating “dislike extremely” (1) to “neither like nor dislike” (5) to “like extremely” (9). (C) Panelists had higher hedonic ratings for champagne delivered in the winery context as compared to the bar; bars denote mean plus SEM. Asterisk denotes p < 0.05. (D) 360 degree virtual bar context. (E) 360 degree virtual winery context.

