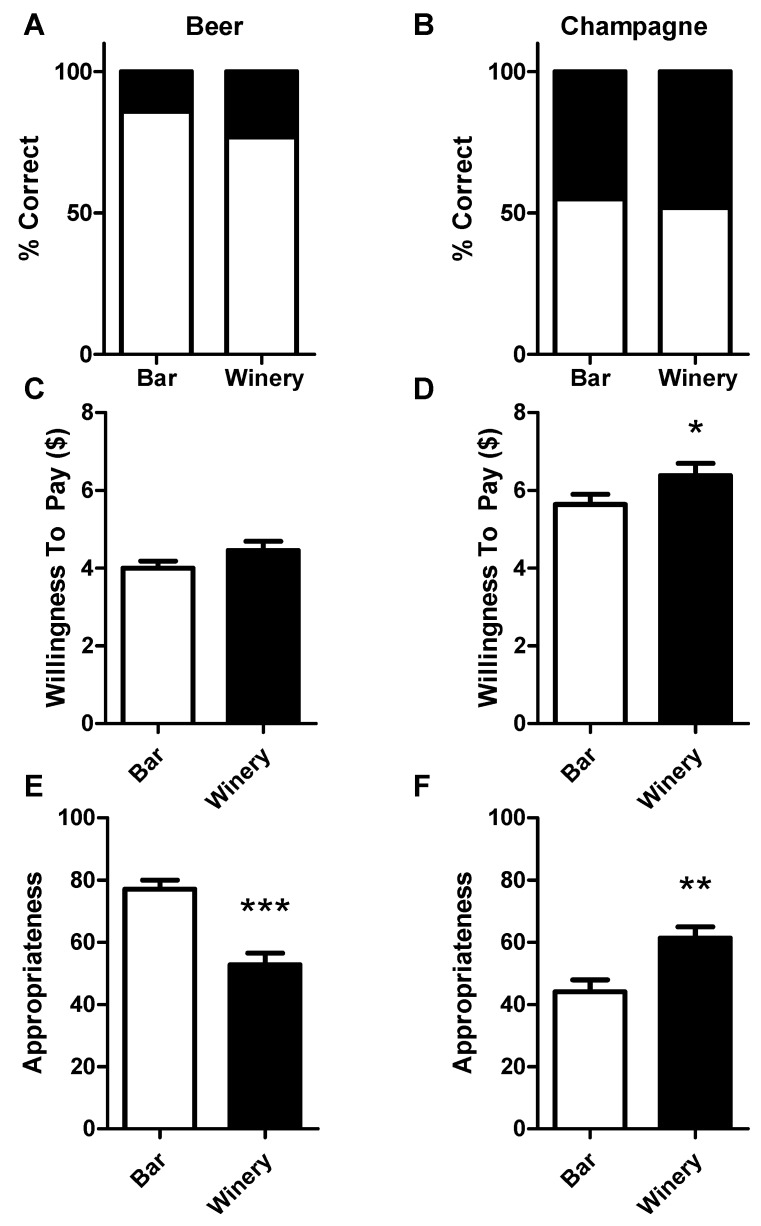
Figure 3.
(A) Panelists’ identification of beer samples presented in the study (correct identifications in white, incorrect in black). (B) Panelists identified the champagne sample approximately as well in both the bar and winery contexts. (C) Panelists showed no difference in the amount they were willing to pay for beer in either context; bars denote mean plus SEM. (D) Panelists were willing to pay almost a dollar more for the champagne sample while in the winery than the bar context; bars denote mean plus SEM. (E) Beer appropriateness for context, from “not appropriate at all” (0) to “very appropriate” (100); bars denote mean plus SEM. (F) Champagne appropriateness for context; axis as E; bars denote mean plus SEM. Asterisks denote: * p < 0.05; ** p < 0.01; *** p < 0.001.

