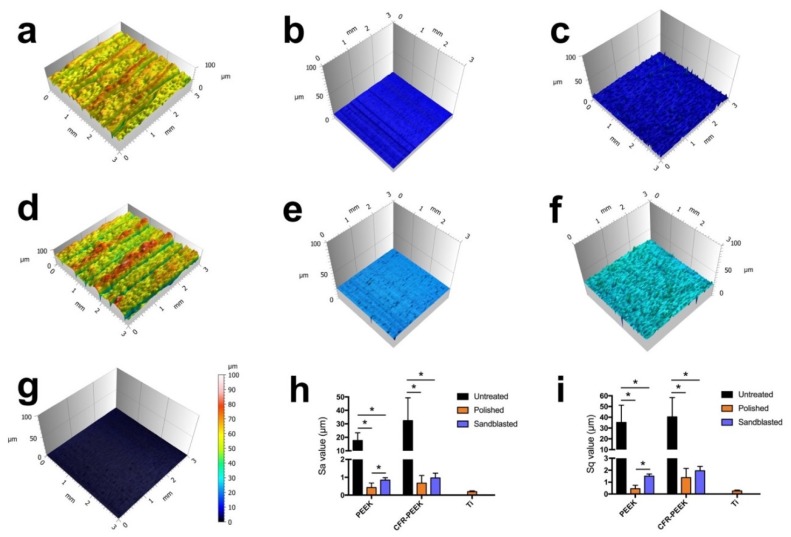
Figure 4.
Reconstructed three-dimensional (3D) surface topographies of analyzed samples, and Sa and Sq values: (a) untreated PEEK; (b) polished PEEK; (c) sandblasted PEEK; (d) untreated CFR-PEEK; (e) polished CFR-PEEK; (f) sandblasted CFR-PEEK; (g) polished Ti; (h,i) Sa and Sq values of as-printed, polished, and sandblasted PEEK and CFR-PEEK samples, the polished Ti was used as an additional reference. The data are presented as means ± standard deviation, * p < 0.05.

