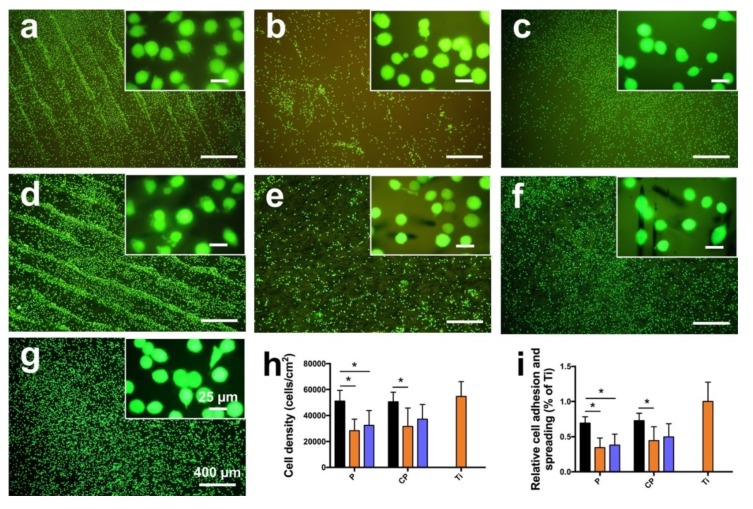
Figure 7.
LIVE/DEAD staining of L929 cells on PEEK and CFR-PEEK samples after culturing for 24 h, with Ti as an additional control. (a) untreated PEEK; (b) polished PEEK; (c) sandblasted PEEK; (d) untreated CFR-PEEK; (e) polished CFR-PEEK; (f) sandblasted CFR-PEEK; (g) Ti. (h,i) shows the quantitative cell density and quantification of the mean surface area covered by cells. The data are presented as means ± standard deviation, * p < 0.05. P: PEEK; CP: CFR-PEEK; black bar: untreated group; orange bar: polished group; blue bar: sandblasted group. Cytotoxic effects, indicated by dead (red stained) cells, are not detectable.

