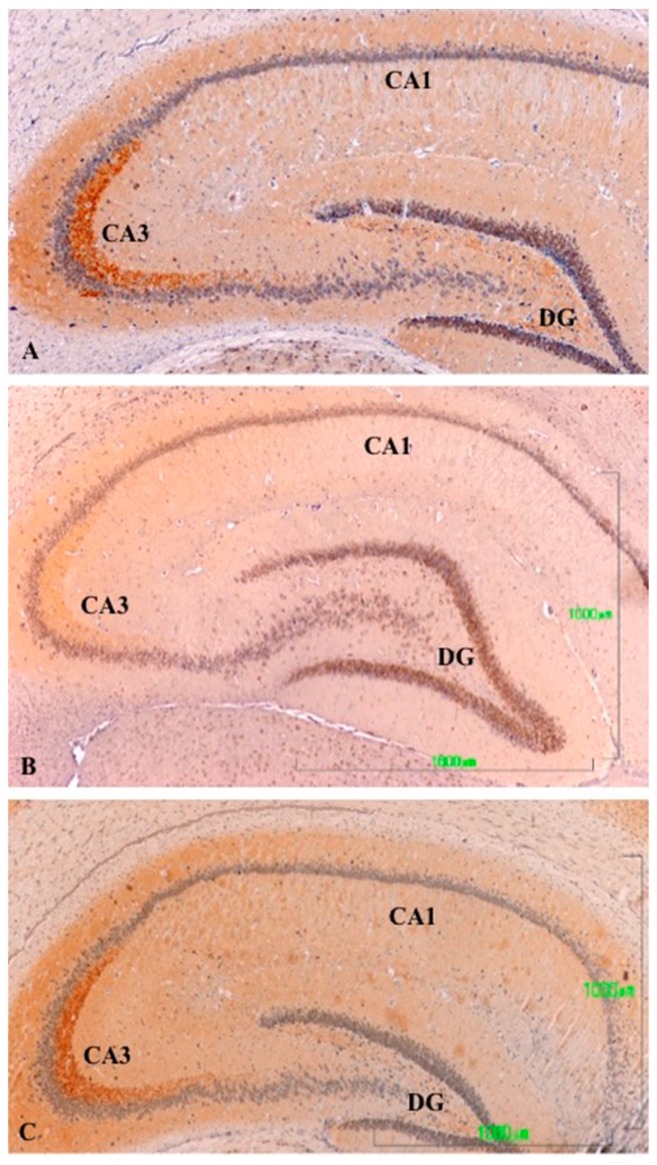
Figure 3.
(A–C). Tyrosine hydroxylase immunoreactivity in the hippocampus of rats from the control (A), paroxetine (B), and agomelatine (C) groups. Bars, 1000 m. (Figure 3A is presented at the same magnification as that of Figure 3B,C). The immunoreactivity is limited to the CA3 area and is greatly reduced following treatment with paroxetine. DG, dentate gyrus; CA, cornu ammonis.

