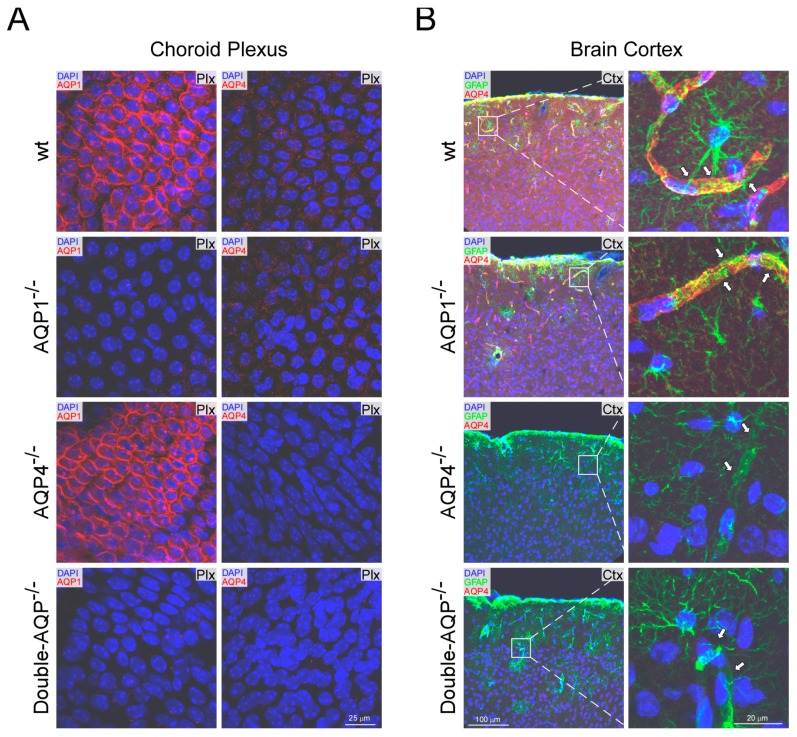
Figure 1.
Histological analysis of AQP1 and AQP4 expression in wt and cerebral AQPs KO mice. (A) AQP1 and AQP4 immunofluorescence images from choroid plexus obtained from wt, AQP1−/−, AQP4−/− and double-AQP−/− KO mice. (B) Immunofluorescence AQP4 and GFAP images obtained from brain coronal sections of wt, AQP1−/−, AQP4−/− and double-AQP−/− KO mice, and high magnification images from the insets displayed. The arrows indicate the perivascular foot processes of GFAP+ astrocytes. GFAP, glial fibrillary acidic protein; DAPI, 4′,6-diamidino-2-phenylindole. The images shown are representative examples of three independent animals analyzed for each genotype.

