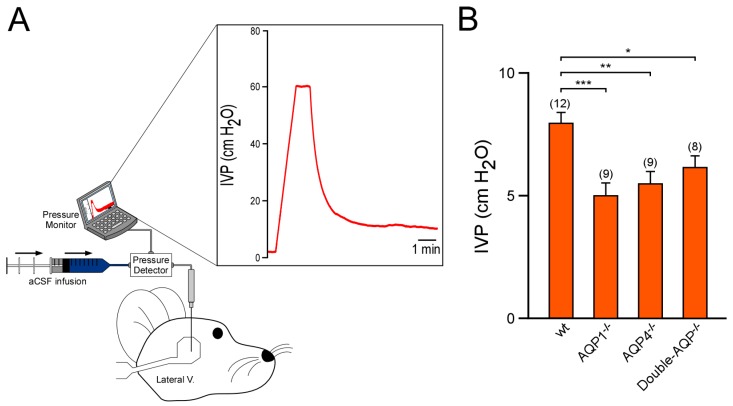
Figure 3.
Study of the intraventricular pressure of cerebral AQPs knock out mice. (A) Schematic diagram showing the experimental setup used to perform the records of IVP. The graph displayed shows an example of IVP record. Briefly, the micropipette, with aCSF infusion, placed in the parietal cortex above the lateral ventricle produced a peak of pressure. Once the pressure was >50 cm H2O, the aCSF infusion was stopped, and the pipette was slowly lowered. The pressure drops promptly when the micropipette entered the lateral ventricle. Hereafter, the IVP was recorded. (B) IVP values obtained from wt, AQP1−/−, AQP4−/− and double-AQP−/− KO mice. Data are presented as mean ± S.E.M. The number of animals analyzed per experimental condition is indicated in parenthesis in the figure. * p < 0.05; ** p < 0.01; *** p < 0.001.

