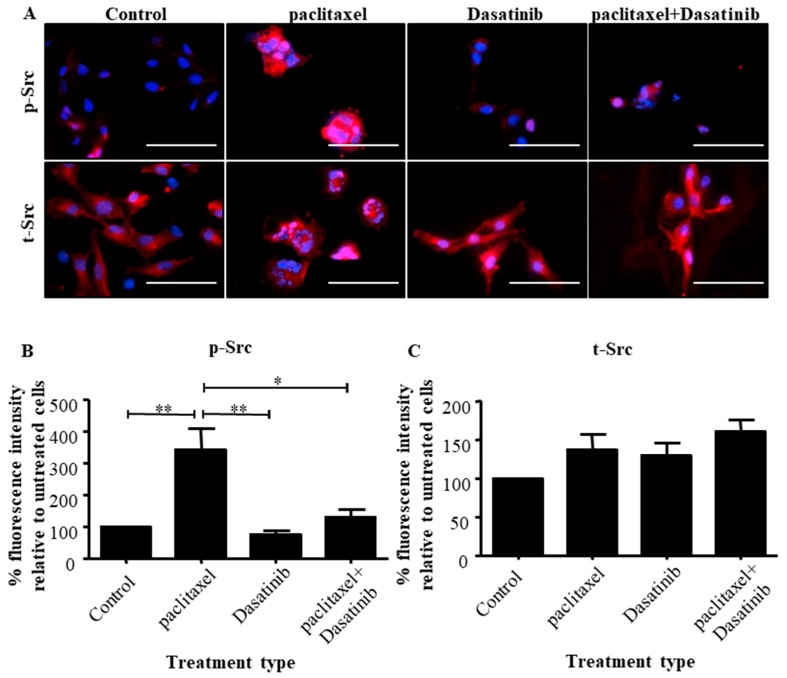
Figure 3.
Dasatinib inhibits paclitaxel-induced Src activation in HEY cells. (A) Immunofluorescent visualization of expression and localization of the p- or t-Src proteins in untreated HEY cells or following a 24 h treatment with paclitaxel (0.05 µg/mL), Dasatinib (10 µM) or a combination of both. Staining was visualized using the secondary Alexa 590 (red) fluorescent-labelled antibodies and nuclei were detected by DAPI (blue) staining. Images are representative of three independent experiments. Magnification 400× scale bar = 250 µm. Quantification of (B) p-Src and (C) t-Src fluorescent intensities were determined using Fiji software. Results are expressed as the percentage of the average fluorescent intensity value relative to untreated cells ± SEM (n = 3/group). Significance between the groups and is indicated by * p < 0.05, ** p < 0.01.

