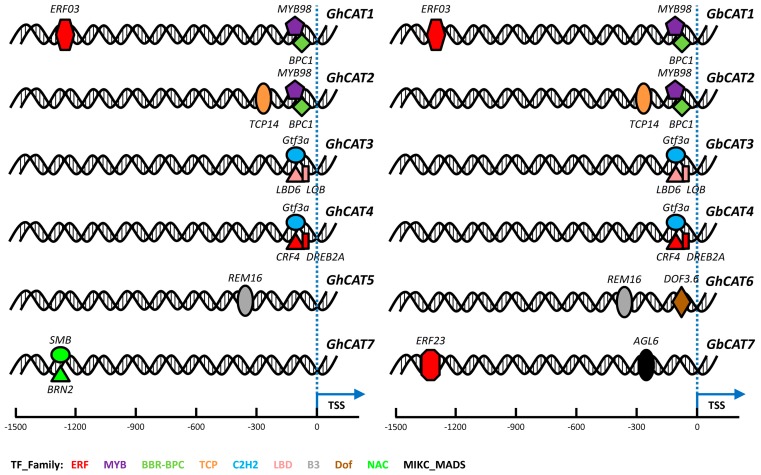
Figure 6.
The schematic diagram of the highly conserved transcription factor binding sites (TFBSs) relative to that of the upland cotton and sea-island cotton CAT gene transcription start site (TSS). The information of potential TFBS was predicted using the Binding Site Prediction tool in PlantTFDB 4.0 with a stricter parameter: threshold p-value ≤ 1 × 10⁻⁶ (http://planttfdb.cbi.pku.edu.cn/).

