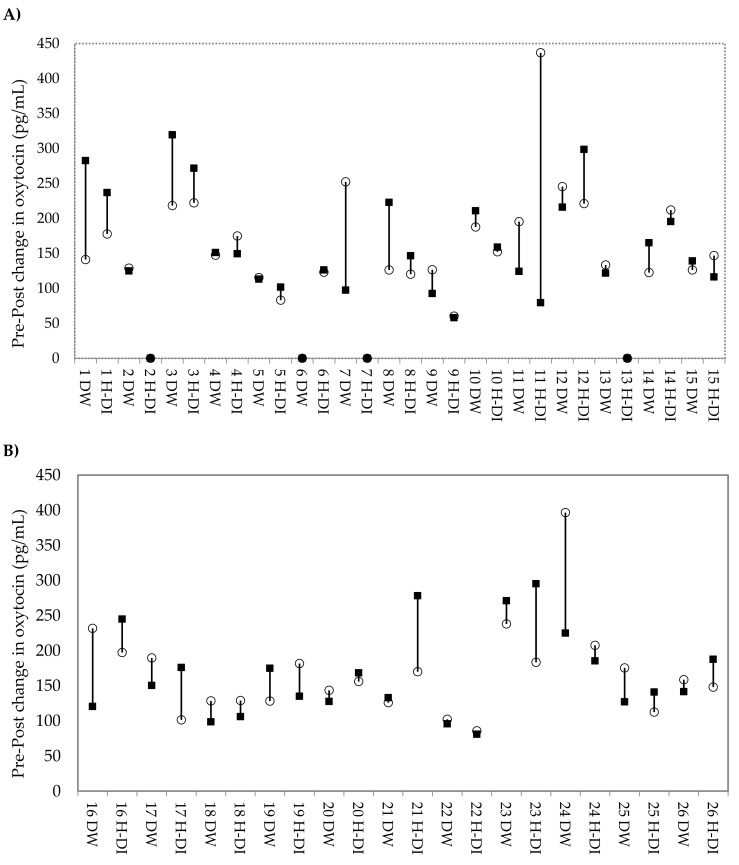
Figure 1.
Change in urinary oxytocin concentration from pre to post condition for each dog. DW: dog-walking; H-DI: human–dog interaction. ○ indicates the pre-condition concentration, and ▪ indicates the post-condition concentration. In the case ○ and ▪, both fall on 0, which indicates missing data (n = 4 conditions). Dogs are displayed in order of ascending total MDORS score, from smallest to largest. (A) Dogs whose owners reported below median levels of attachment. (B) Dogs whose owners are reported above the median levels of attachment.

