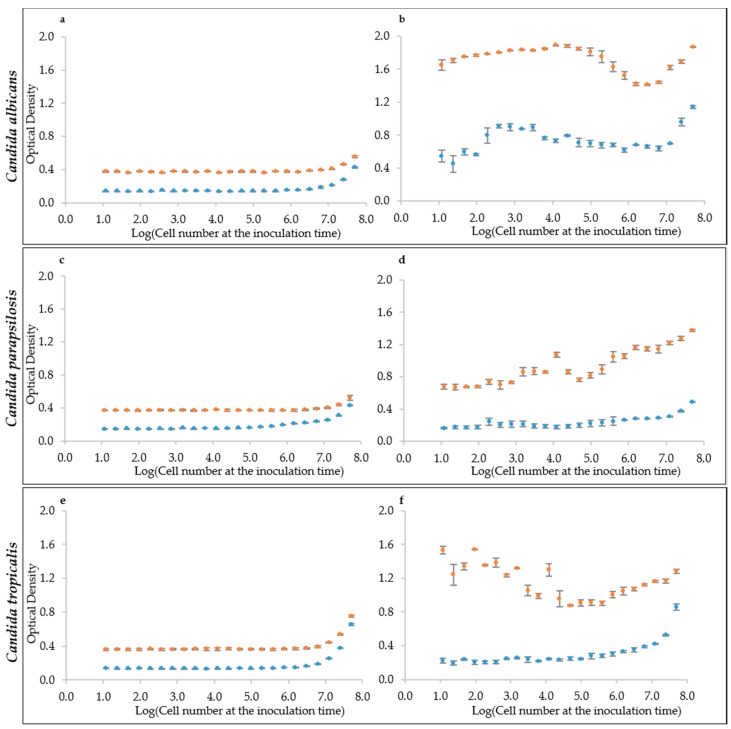
Figure 2.
Optical Densities distribution at the inoculum time and after 24 h growth. (a,c,e) Inoculation time cell densities for the species: (a) C. albicans (CMC1698); (c) C. parapsilosis (CMC1981); and (e) C. tropicalis (CMC1827). (b,d,f) Optical density values after 24 h growth. RPMI medium is represented by the light-blue marker while YEPD by the orange one.

