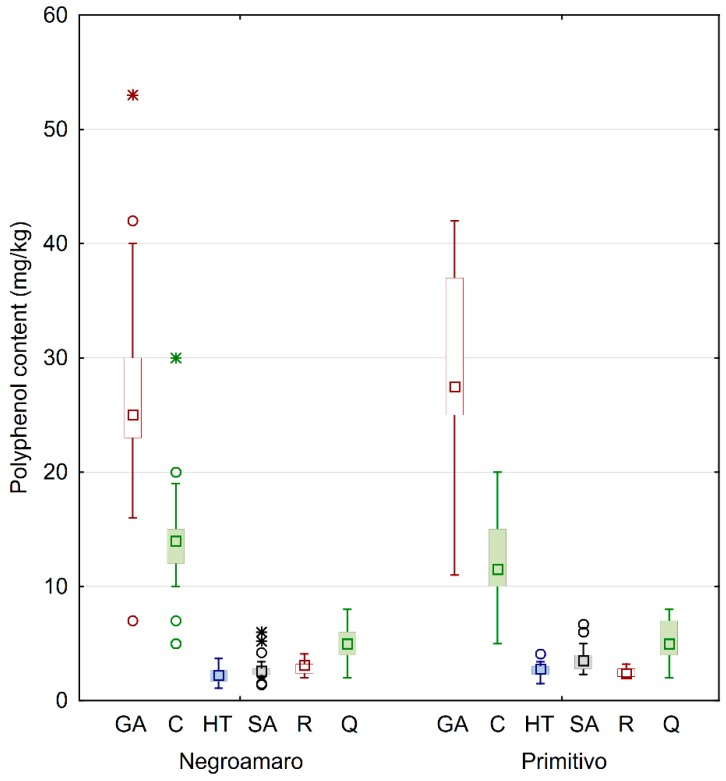
Figure 2.
Box and whiskers plot of the analyzed phenols grouped by type of wine. The squares inside of boxes are median values. The height of the box is equal to the interquartile distance, indicating the distribution for 50% of the data. The whiskers outside the box represent non-outlier data, while circles and stars represent outlier and extreme values, respectively. GA: gallic acid; C: catechin; HT: hydroxytyrosol; SA: syringic acid; R: trans-resveratrol; Q: quercetin.

