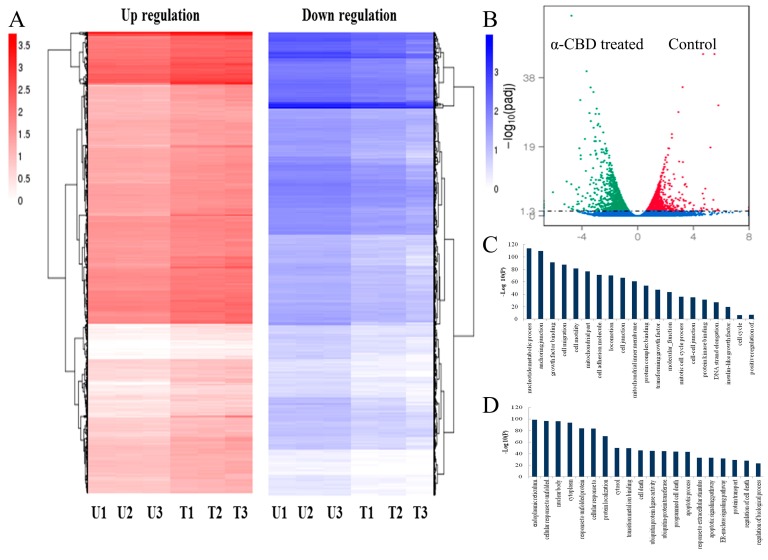
Figure 5.
Overview of genes differentially expressed in α-CBD-treated and untreated HepG2 cells. (A) Venn diagram of gene expression; (B) volcano plot of differentially expressed genes; (C) clustering analysis of differentially expressed genes; and (D) GO analysis of differentially expressed genes. The control groups are represented as U1, U2, and U3, whereas, the experimental groups are represented as T1, T2, and T3.

