Figure 2.
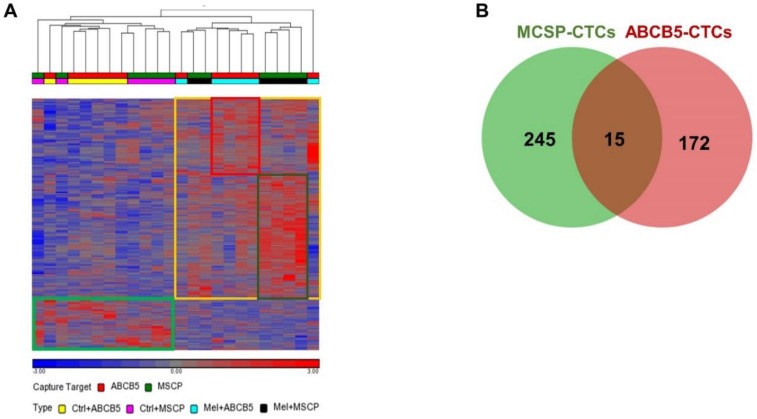
MCSP and ABCB5 CTCs have distinctive gene expression patterns. (A) Unsupervised hierarchical clustering analysis of differentially expressed genes between CTC fractions enriched from samples of healthy donors (N = 6) and melanoma patients (N = 6) using immunomagnetic beads targeting MCSP or ABCB5. Each row is a single gene and each column is a single sample. Red indicated up-regulation and blue indicates down-regulation according to the colour scale at the bottom. The squares indicate the genes that were up-regulated in melanomas (yellow box) and in controls (light green box). Genes that are differentially expressed (with ANOVA p < 0.05 and fold difference 2 vs. respective controls) in either cell type (MSCP or ABCB5 CTCs) were used to perform an unsupervised hierarchical clustering. This analytical approach discriminated the gene expression patterns from MCSP- (dark green box) and ABCB5-enriched (red box) CTC fractions. (B) Comparison of up-regulated genes between MCSP- (green circle) and ABCB5-enriched (red circle) CTC fractions found only 15 genes shared between these two CTC fractions.

