Figure 1.
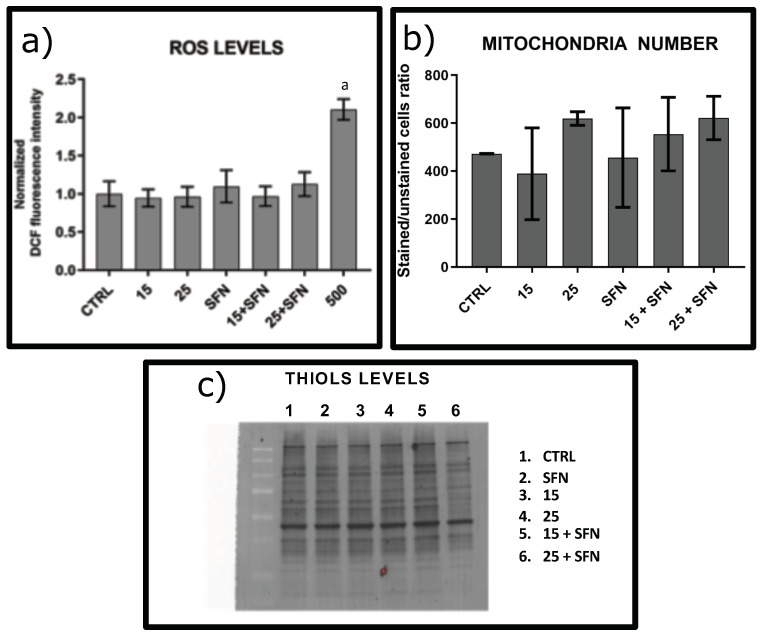
Evaluation of oxidative status after treatment with sublethal concentration and repeated exposure with hydrogen peroxide without or with 1 M SFN. (a) ROS level Subconfluent cells treated as described in Figure S1 and Material and Methods Section with 15 or 25 M hydrogen peroxide (15 or 25) without or with 1 M SFN (15+SFN, or 25+SFN, respectively) up to eight days and incubated in 10 M H2DCFDA (Thermo Fisher, cod.D399) in pre-warmed PBS for 1 h at 37 C in 5% CO. Cells were also treated with 500 M hydrogen peroxide for 1 h and then the fluorescence was immediately quantified (positive control). Fluorescence was determined using Ensight microplate fluorescence reader (Perkin Elmer) using Ex/Em: 492–495/517–527 nm. Results are reported as mean fluoresce values for each sample. Each bar represents the mean and the corresponding error bars of 16 independent measures for all the treatments and untreated cells with the exception of 500 M hydrogen peroxide where we carried out four independent measurements. a: p < 0.0001 versus untreated cells. (b) Numbers of Mitochondria: Cells treated as described in (a) were quantified using MitoTracker probe, which passively diffuses across the plasma membrane and accumulates in active mitochondria. Subconfluent cells were incubated with 250 nM MitoTracker (Thermo Fisher, cod. M7512) for 45 min at 37 C in 5% CO. Fluorescence was detected using FACS Vantage SE Becton Dickinson flow cytometry and the data were analyzed by FlowJo. Results are reported as the ratio between the intensity of fluorescence of each sample with respect to unstained cells due to autofluorescence. The bars are the mean with the statistic errors of three independent experiments. (c) Levels of thiols into total protein. Total cellular proteins were obtained by cell homogenization with ice-cold lysis buffer. The lysate was incubated on ice for 30 min and centrifuged at 10,000 rpm for 10 min at 4 C to remove cell debris. The concentration of protein was assessed using BCA protein assay. To detect thiols present into proteins a biotin-maleimide assay was carried out. First, 1 mg/mL of protein was incubated with 75 M biotin-maleimide solution for 1 h at RT and then mixed to Laemmli sample buffer, boiled for 5 min at 90 C and immediately loaded on 12% SDSPAGE gel. The proteins were then electroblotted onto a low-fluorescence polyvinylidene difluoride (LF-PVDF) membrane. Biotin tag was revealed using streptavidin-HRP assay. Biotinylated proteins were visualized by ECL detection (cod.1705061, Biorad) using Chemidoc Touch Imaging System (Biorad). ECL signals were normalized with respect to PVDF stain free. This gel is representative of four independent experiments carried out.

