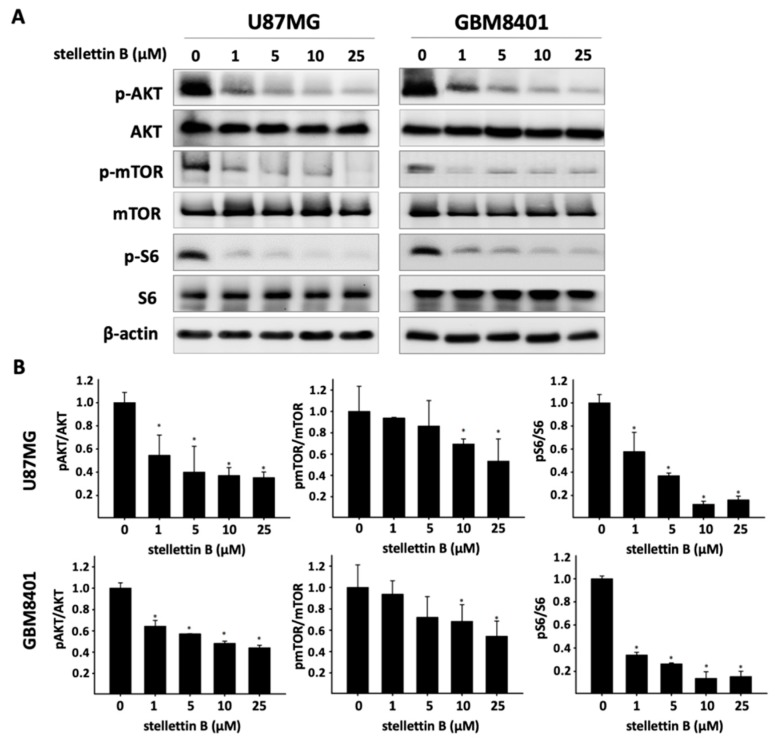
Figure 3.
Effect of stellettin B on the Akt/mTOR pathway in glioblastoma cells. (A) U87MG and GBM8401 cells were treated with 0, 1, 5, 10, or 25 μM stellettin B for 24 h. Western blot analysis was performed to study the expression of p-Akt, Akt, p-mTOR, mTOR, pS6, and S6. β-Actin was used as a loading control. (B) p-Akt/Akt, p-mTOR/mTOR, and p-S6/S6 were quantified. Values are expressed as the mean ± SD (n = 3). * p < 0.05 relative to controls.

