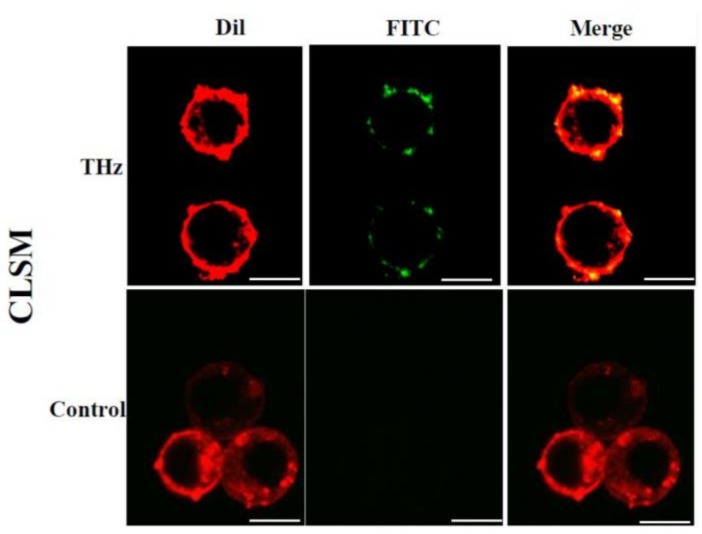
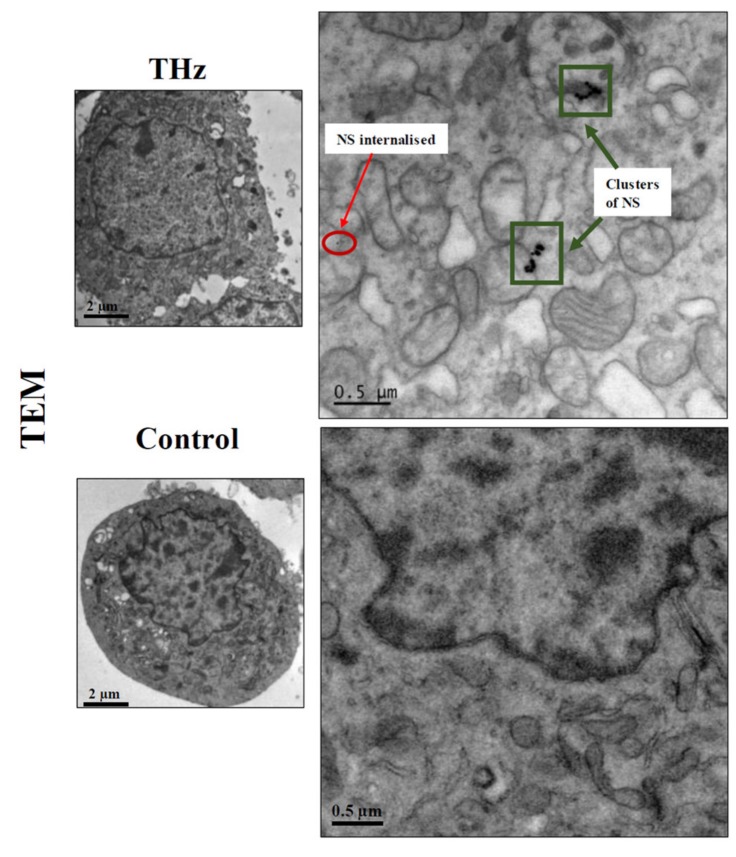
Figure 1.
Nanosphere internalisation of PC 12 cells following a 10 min exposure of THz radiation. Confocal laser scanning microscopy (CLSM; top row) images illustrate the uptake of silica nanospheres (FITC) by the THz treated cells whereas the untreated control does not exhibit any nanosphere uptake. No signal was detected in the FITC channel for the untreated cells. Scale bar is 5 μm. Thin sliced transmission electron microscopy (TEM) micrographs confirm silica nanospheres (NS) being internalised by the PC 12 cells (red arrow; bottom). Nanospheres are also seen lining the cell membrane whereas no nanosphere internalisation was observed in the untreated control cells. Scale bar is 1 μm.


