Figure 4.
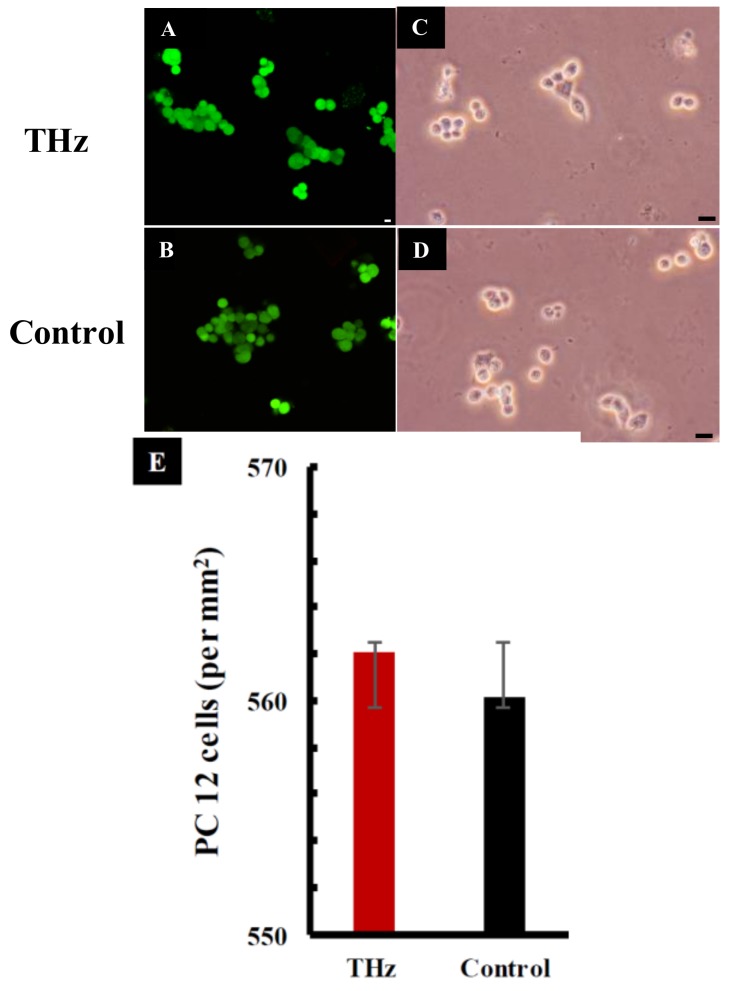
Physiological analysis of PC 12 cells after THz exposure of 10 min. (A) Confocal laser scanning images showing viable (green) PC 12 cells after being exposed to synchrotron source THz radiation for 10 min. (B) The untreated control cells. Scale bar is 5 μm. (C) Optical micrographs of PC 12 cells following exposure to THz radiation and (D) the untreated control. Scale bar is 10 μm. (E) Quantification of viable PC 12 cells following exposure to THz radiation. No significant changes in cell viability were detected between the THz treated and the control group (p = 0.977). Data are presented as mean ± SD and are representative of the three independent repeats.

