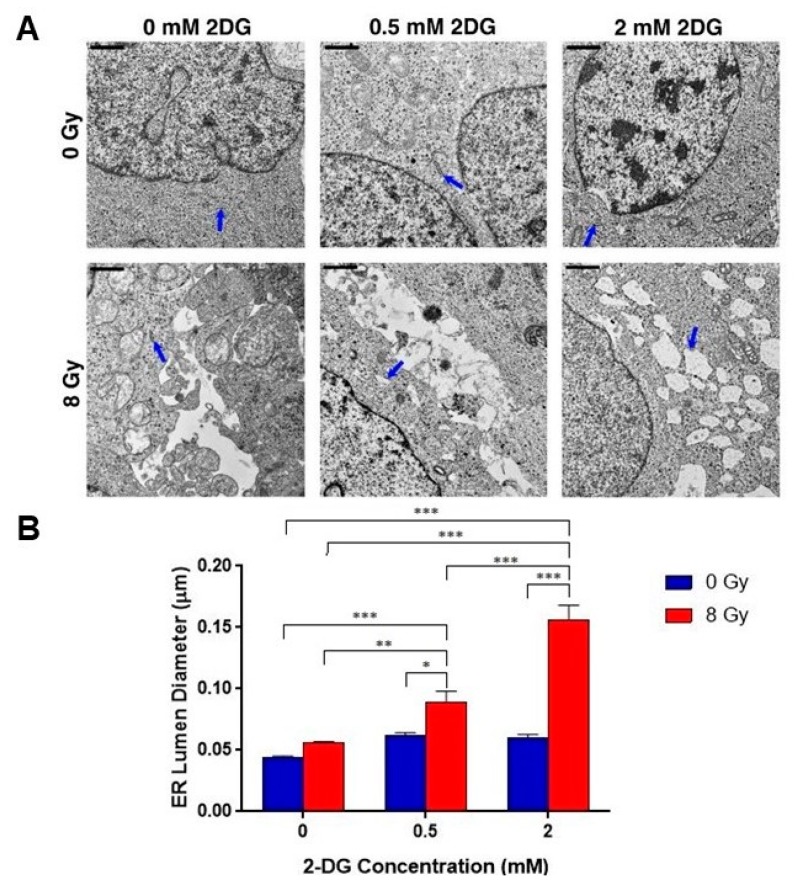
Figure 5.
Combination radiotherapy and 2-DG increases ER dilation in GSCs. (A) Transmission electron microscopy (TEM) analysis of GSCs (Glio14 shown) comparing ultrastructural responses in non-treated lines and cells exposed to 8 Gy of radiation and/or increasing concentrations of 2-DG. Endoplasmic reticulum (ER) highlighted with blue arrows. Scale bar: 0.5 µm. (B) Quantitative analysis of ER luminal diameter, as a surrogate marker for ER stress, using TEM images (Glio14 shown). Results are representative averages of at least five images from two independent studies and are displayed as mean ± SEM. * p < 0.05, ** p < 0.01, *** p < 0.001. Mann-Whitney test.

