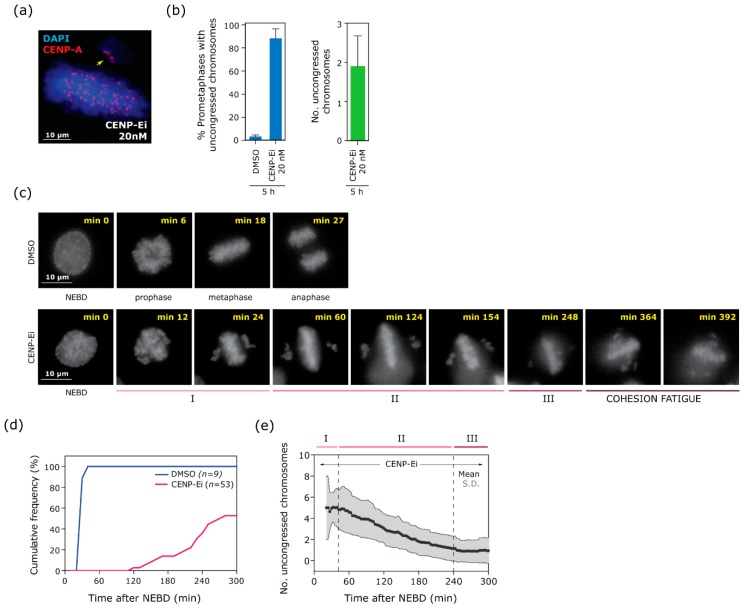
Figure 1.
Inhibition of centromere-associated protein E (CENP-E) results in faulty metaphase plate formation and leads to a multi-phase chromosome congression pattern followed by cohesion fatigue. (a) Example of immunofluorescence image of retinal pigment epithelium-hTert (RPE1) cells treated for 5 h with centromere-associated protein E inhibitor (CENP-Ei), stained with CENP-A antibody to mark centromeres (red). (b) Congression error rate and average number of uncongressed chromosomes per erroneous metaphase. Mean and standard deviation (S.D.) from three independent experiments is shown. Total number of cells analysed: 138 for DMSO treatment, 236 for CENP-Ei treated. Total number of uncongressed chromosomes: 507. (c–e) Live-cell imaging of RPE-1 cells stably expressing H2B-RFP. Movies started immediately after drug addition, cells were imaged every 3 min for 8 h in total. (c) Representative frames of live cell imaging of RPE-1 cells stably expressing H2B-RFP. Top panels: Control (DMSO) cell going into a normal mitosis. Bottom panels: CENP-Ei treated cell undergoing faulty chromosome congression. (d) Cumulative frequency from nuclear envelope breakdown (NEBD) to anaphase onset of cells treated with CENP-Ei (red line), compared to control (DMSO) cells (blue line). Timing has been normalised to NEBD (min 0). (e) Mean (black dots) and S.D. (grey shade) of uncongressed chromosome number over time in cells treated with CENP-Ei. The top coloured lines reflect three different phases of congression: I) metaphase plate formation, II) progressive chromosome congression, III) pause phase. See also Figure A1 for individual cell plots. Data in (d) and (e) is from cells imaged for ≥300 min post-NEBD, or undergoing anaphase within 300 min, from three independent experiments (15 cells arrested in prometaphase and 21 cells going into anaphase in total).

