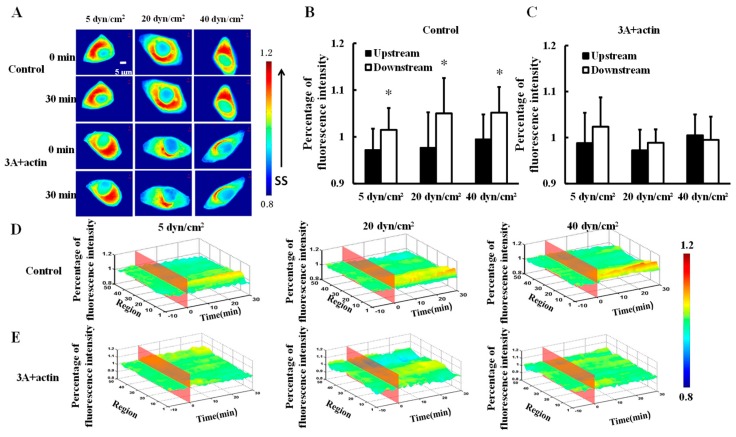
Figure 3.
Effect of HSP27 phosphorylation on shear-stress-induced actin polar distribution. (A) Fluorescence images of HeLa cells transfected with mCherry-actin (control) and cells co-transfected with mCherry-actin and HSP27-3A (3A+actin) before and after 30 min of 5, 20, and 40 dyn/cm2 of shear stress stimulations. (B,C) The percentage of mCherry-actin fluorescence intensity comparison of upstream to downstream in the control and 3A+actin groups (* p < 0.05 when comparing to the upstream; values are from the 30 min time point). (D,E) The three dimensional (3D) distribution map of mCherry-actin under 5, 20, and 40 dyn/cm2 shear stresses in the control and 3A+actin groups (n for 5, 20, and 40 dyn/cm2 in the control group is 8, 14, and 11, and n in the 3A+actin group is 13, 9, and 12, respectively).

