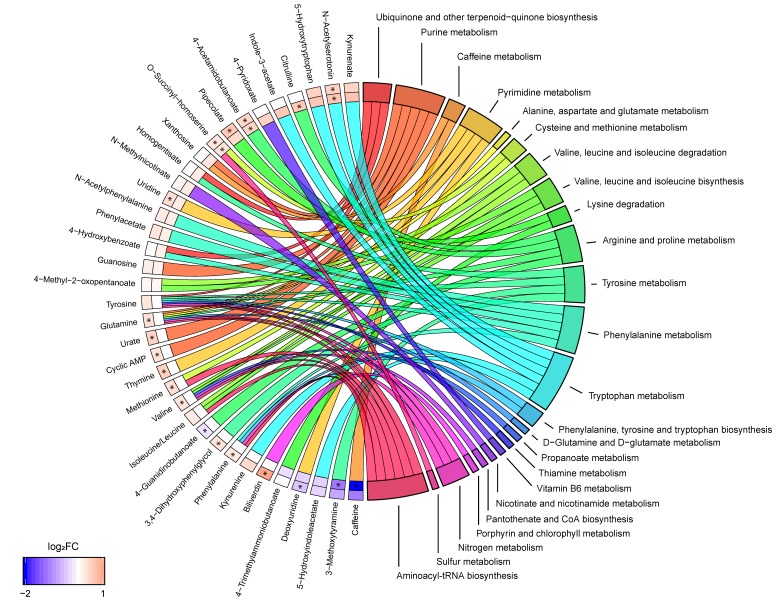
Figure 2.
Metabolite to biochemical pathway linkages. The altered metabolites have been linked with pathways as color-coded ribbons. Blue-to-red coding next to the altered metabolites indicates the magnitude and direction of the log2 fold change (FC), where the inner layer represents FC in comparison with controls (SP-C) and the outer in comparison with RRMS (SP-RR). Significant FC with an FDR < 0.05 have been marked with a ‘*’.

