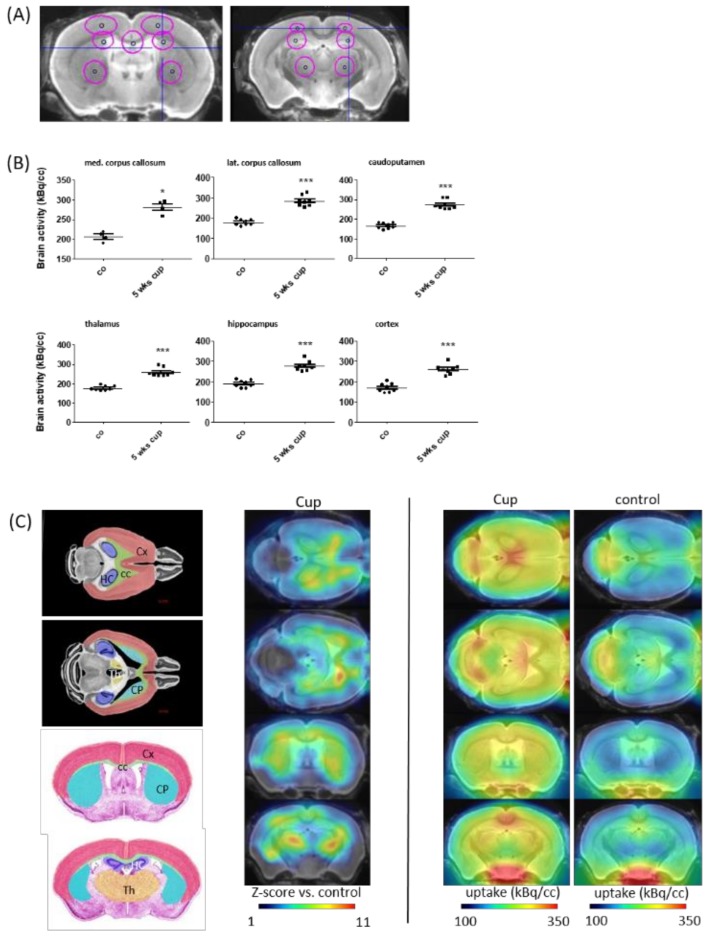
Figure 2.
In vivo imaging demonstrates an increase in [18F]-GE180 uptake after cuprizone-intoxication. (A) The definition of VOIs (volumes of interest), demonstrated in a mouse brain MRI atlas in the coronal slides: medial corpus callosum (2.2 mm3), lateral corpus callosum (2.9 mm3), caudoputamen (4.4 mm3), thalamus (4.4 mm3), hippocampus (4.4 mm3), and cortex (6.7 mm3). (B) The quantification of radioligand uptake in the control animals (n = 4) and after a 5-week cuprizone intoxication period (n = 4). (C) Schematic illustration of the measured areas and cumulative heat map illustrating radioligand uptake in cuprizone-treated mice. The color codes demonstrate the standardized radioligand uptake levels relative to the controls (Z-scores; left column), and the normalized uptake in cuprizone-treated (middle column) and control (right column) mice. Cx (cortex); CC (corpus callosum); HC (hippocampus); Th (thalamus); CP (caudoputamen). Differences were determined using Mann–Whitney tests. * p < 0.05, ** p < 0.01, and *** p < 0.001.

