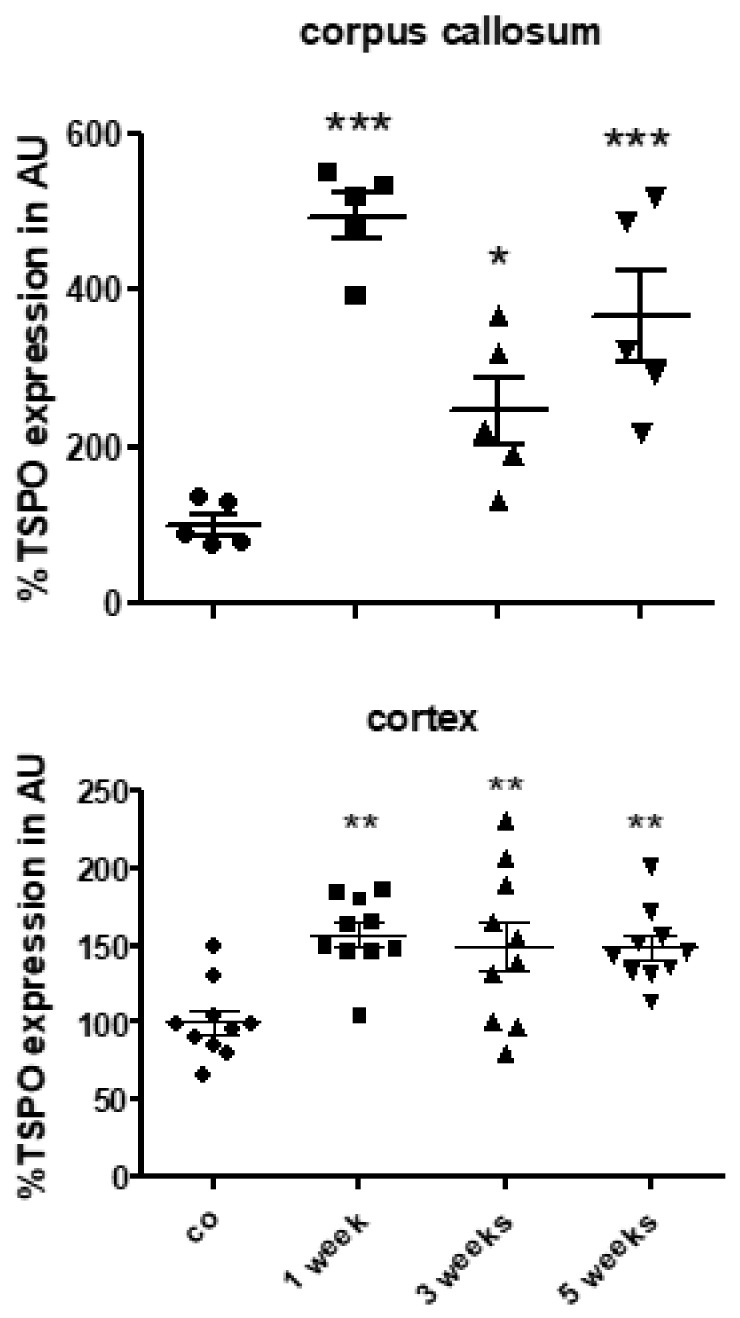
Figure 4.

Expression levels of Tspo mRNA during the course of cuprizone-induced demyelination. Tspo mRNA levels in the control animals (n = 5) and the animals intoxicated with cuprizone for one (n = 5), three (n = 5) or five (n = 5) weeks. Differences between the groups were statistically tested using one-way ANOVA with the obtained p-values corrected for multiple testing using the Dunnett’s post-hoc test; * p ≤ 0.05, ** p ≤ 0.05, *** p ≤ 0.001.
