Figure 6.
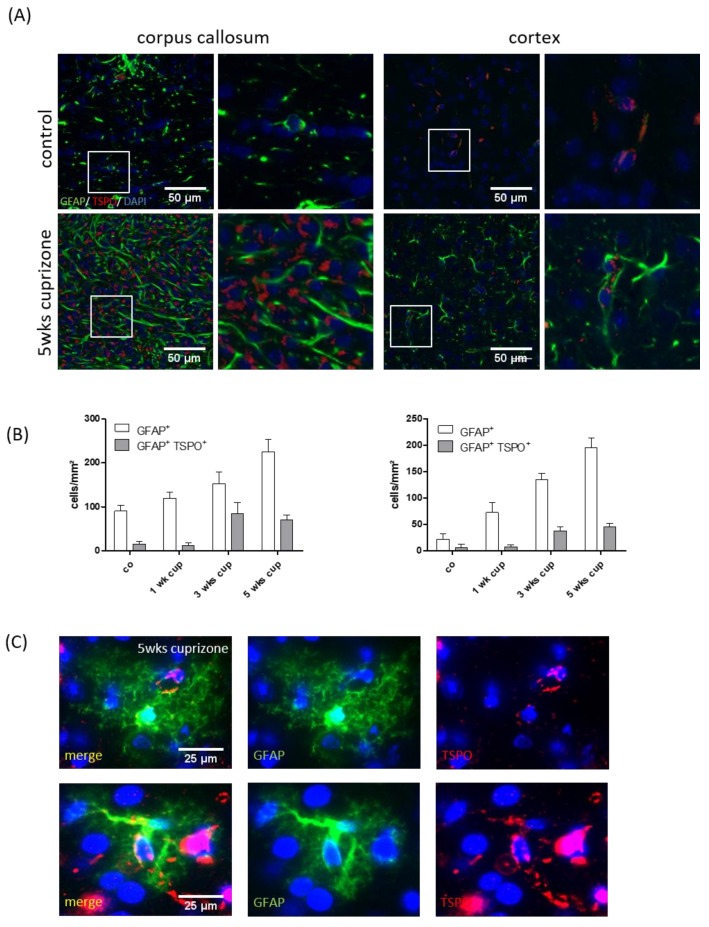
Co-localization of TSPO with the astrocyte marker protein, GFAP (A). The representative images of GFAP (green) and TSPO (red) immunofluorescence double stains in the control and 5-week cuprizone-intoxicated mice (left: corpus callosum; right: cortex). The white boxes highlight cells which are shown on the right-hand side at higher magnification. (B) The quantification of the entire GFAP+ cell densities (white columns) and GFAP+/TSPO+ double positive cell densities (grey columns) in the control animals (n = 4) and the animals intoxicated with cuprizone for one (n = 5), three (n = 5) or five (n = 5) weeks. (C) The representative images demonstrating expression of TSPO (red) in eGFP-expressing astrocytes (green).

