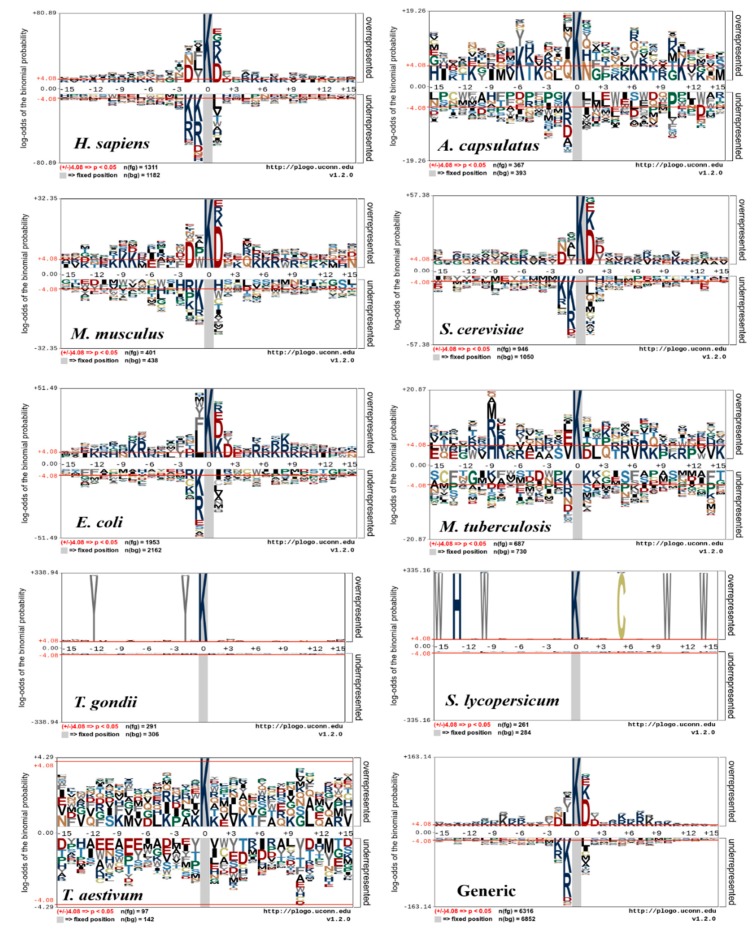
Figure 3.
pLogo graphs of the sequences with the centered succinylation sites. Nine species-specific datasets of H. sapiens, H. capsulatum, M. musculus, E. coli, M. tuberculosis, S. cerevisiae, T. gondii, S. lycopersicum and T. aestivum (https://plogo.uconn.edu/) and their combined (generic) datasets are used. The significantly enriched/depleted amino acid residues (student t-test, p < 0.05) are shown.

