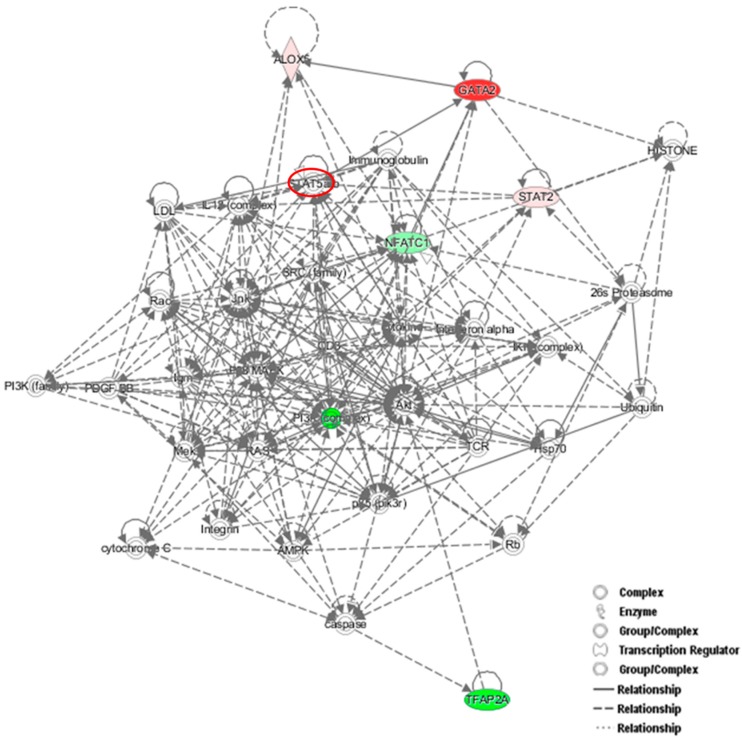
Figure 6.
Protein network analysis using Ingenuity Pathway Analysis (IPA). Proteins identified in the dataset are highlighted in red or in green when they exhibit a higher or a lower content in NFATc1-knockdown cells compared to untransfected cells. The intensity of the node color indicates the expression level or degree of regulation. Genes in uncolored notes were not differentially expressed in our experiment and were integrated into the computationally generated networks based on the evidence stored in the IPA knowledge memory, which indicated relevance to this network.

