Figure 7.
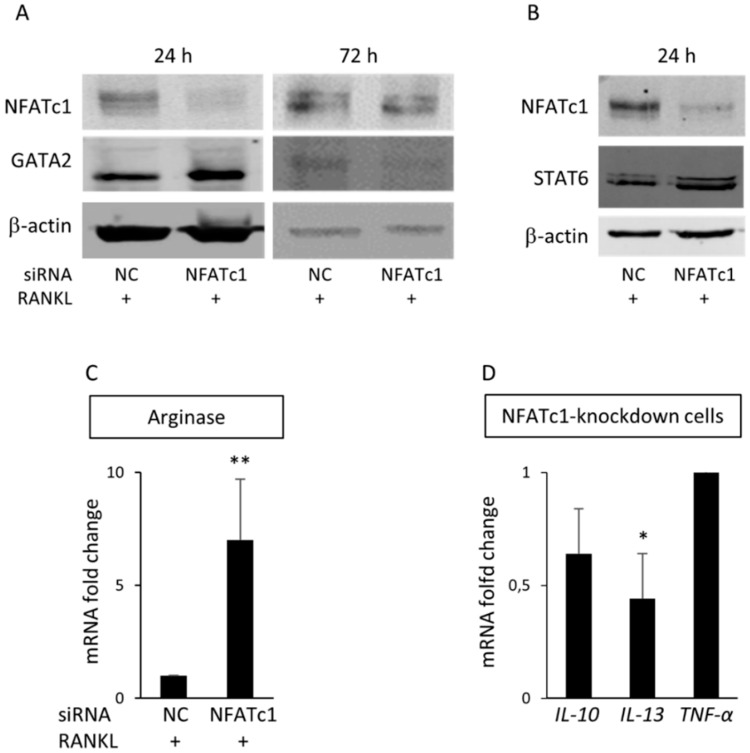
GATA2 is a new target of NFATc1. Cells were transfected with siRNA-NC and siRNA-NFATc1 for 24 and 72 h before protein expression levels were analyzed. (A) Western blot of NFATc1 and GATA2 after 24 and 72 h. (B) Western blot of NFATc1 and STAT6 after 24 h. β-actin was used as loading control. The data shown represent two independent experiments with comparable outcomes. (C) QPCR of Arginase 1. (D) QPCR of IL-10, IL-13 and TNF-α. mRNA expression is presented as relative values to those expressed in siRNA-NC transfected cells arbitrarily set at 1.0. The results shown are the means ± SD of three experiments (each of which was performed in triplicate). * p < 0.05 ** p < 0.01.

