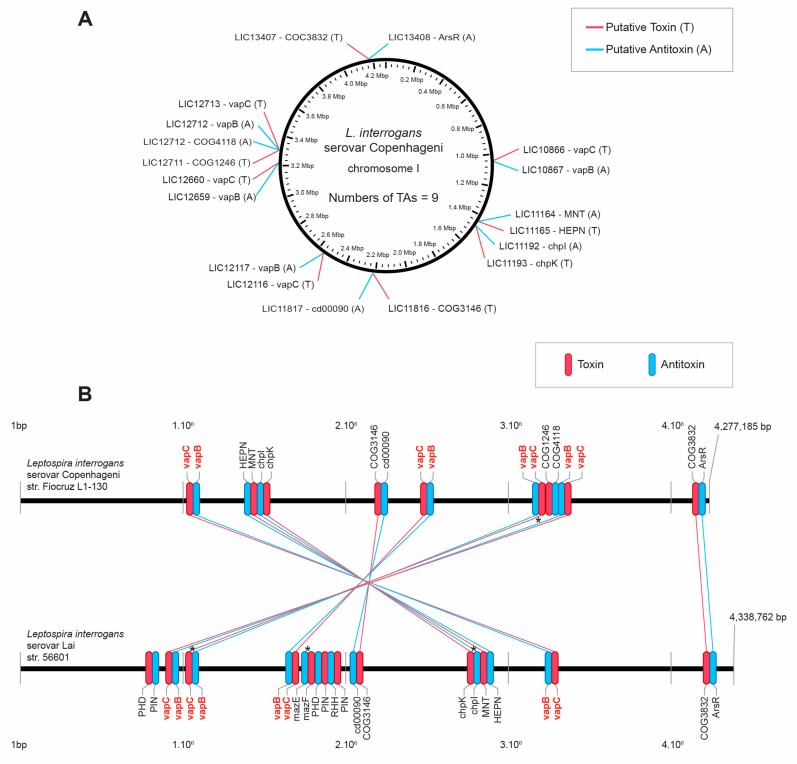
Figure 1.
(A) Location map of toxin-antitoxin (TA) type II systems on the chromosome of L. interrogans serovar Copenhageni. (B) Comparison of the TAs sets of L. interrogans serovar Copenhageni and L. interrogans serovar Lai. In this schema, horizontal black lines represent the chromosomes of Copenhageni and Lai serovars. Red and blue lines indicate the amino acid sequence correspondence of toxins and antitoxins, respectively. Identity between linked toxins is greater than 90%. Toxins and antitoxins are identified by family or domains, as they appear in TAfinder. * denotes TA modules that were experimentally characterized and published.

