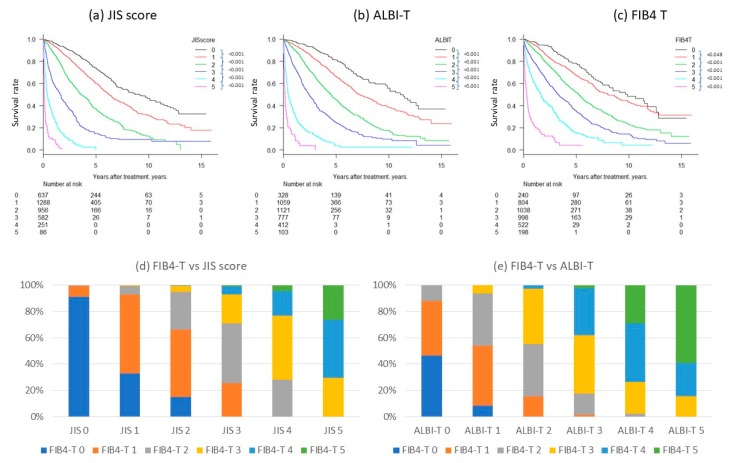
Figure 2.
Overall survival rate according to (a) JIS score, (b) ALBI-T, and (c) FIB4-T (n = 3800) and Distribution of FIB4-T in (d) JIS score and (e) ALBI-T. The difference in survival between FIB4-T (0) and (1) was small compared with those in JIS score and ALBI-T, but prognosis of FIB4-T (0) was significantly better than prognosis of FIB4-T (1) (p = 0.048). The p-value for each group was FIB 4-T 0–1: 0.048, 1–2: <0.001, 2–3: <0.001, 3–4: <0.001, and 4–5: <0.001 (log-rank test). All p-values for each group in JIS score, ALBI-T were <0.001 (log-rank test). As prognostic models, good stratification was possible for all three systems (p < 0.0001). Distribution of FIB4-T in JIS score and ALBI-T were as shown in (d) and (e).

