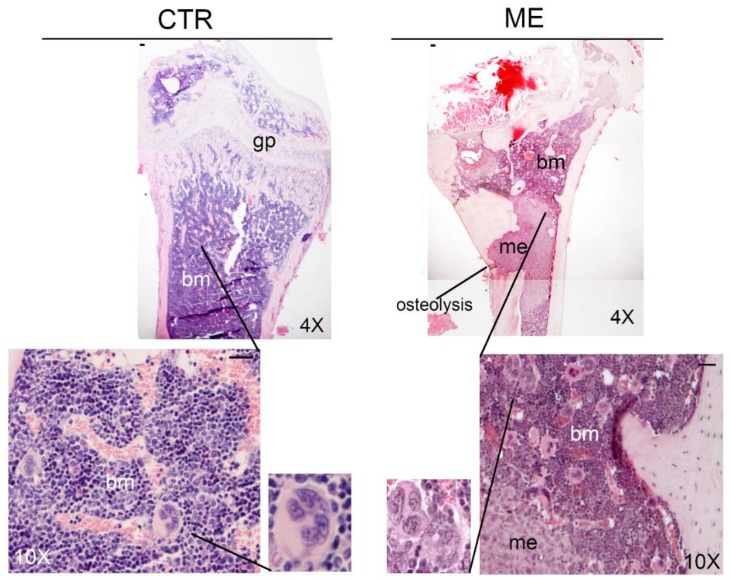
Figure 2.
MK detection in bone marrow of control (CTR) and bone metastasis-bearing mice (ME). Representative images of haematoxylin and eosin (H&E) staining of femur sections in the context of our experiments, with the xenograft model of bone metastasis from breast cancer [52]. Three serial sections were analysed (n = 3). Statistical analysis is reported in Supplementary Materials (Table S1A). me: bone metastasis; bm: bone marrow; gp: growth plate; mk: megakaryocytes. Scale bar = 20 μm.

