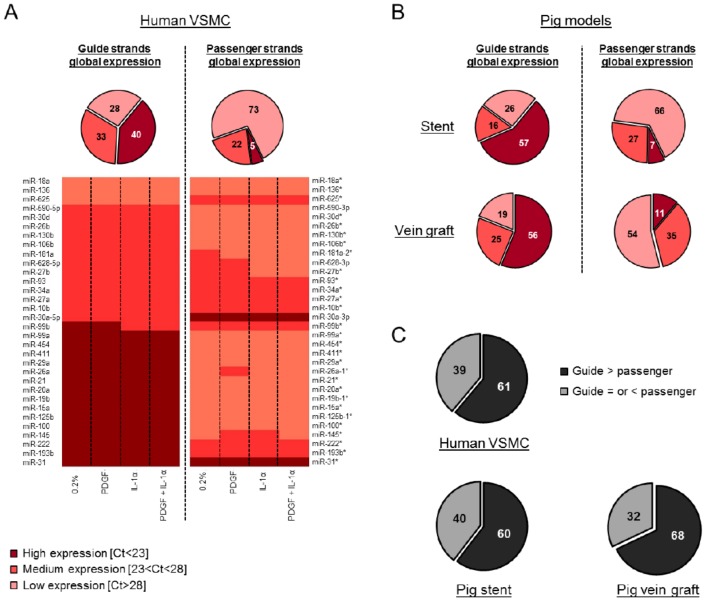
Figure 1.
Low passenger strands expression compared to the guide strands in VSMCs and in vivo. One hundred hairpins were analyzed by TaqMan Low Density Array (TLDA) in human VSMCs (average of n = 3), the porcine models of vein graft failure and in stent restenosis (average of n = 6 for both the porcine models, except for the 7 days DES (drug eluting stent) condition, where n = 5). The level of expression (relative expression, %) was classified into three groups: high (Ct < 23), medium (Ct between 23 and 28) and low (Ct > 28) expressions. These groups are represented as a % in each pie chart. (A) Each pie chart represents the global expression of the guide and passenger strands in human VSMCs. The heat map illustrates the relative abundance of the number of miRNA hairpins that were consistently expressed across three independent patients and represents the level of expression of the guide versus passenger strands. (B) Each pie chart represents the global expression of the guide and passenger strands in the porcine model of in stent restenosis and vein graft failure. (C) Each pie chart represents the expression of the guide versus passenger strands within each independent hairpin.

