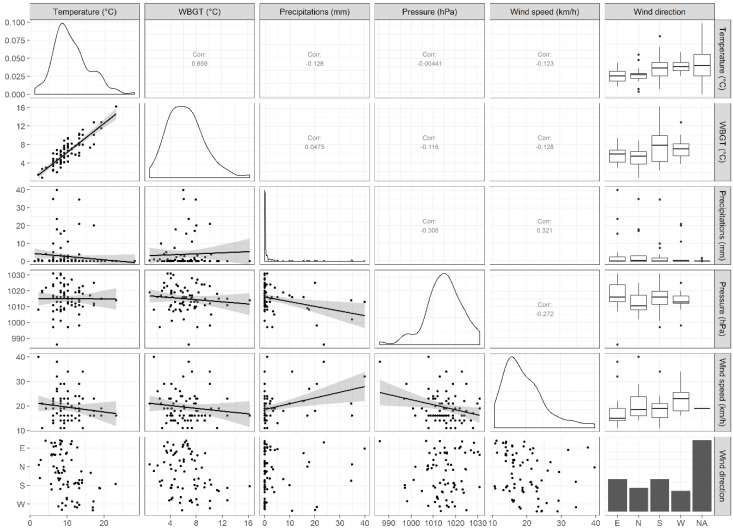
Figure A1.
Pairwise relationship between weather condition variables: matrix of plots. In the upper diagonal there were correlation coefficients between pairs of continuous variables, or box-plots if one variable was categorical. In the lower diagonal, scatter plots with smoothing trend and 95% confidence band were shown. Density plots, for every continuous variable, or bar charts for categorical variables, were shown in the main diagonal. Bar charts included missing values (NA) frequency.

