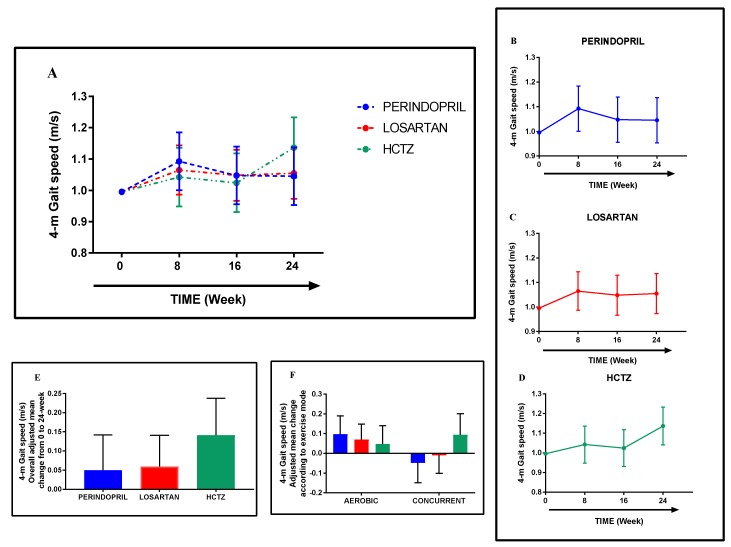
Figure 3.
Adjusted mean change in gait speed from baseline to 24-week follow-up according to the randomization group (A–D). Overall adjusted mean change was within groups (E) and according to exercise mode (F). Data are expressed as adjusted mean change within groups with 95% confidence intervals adjusted to age, sex, and baseline status.

