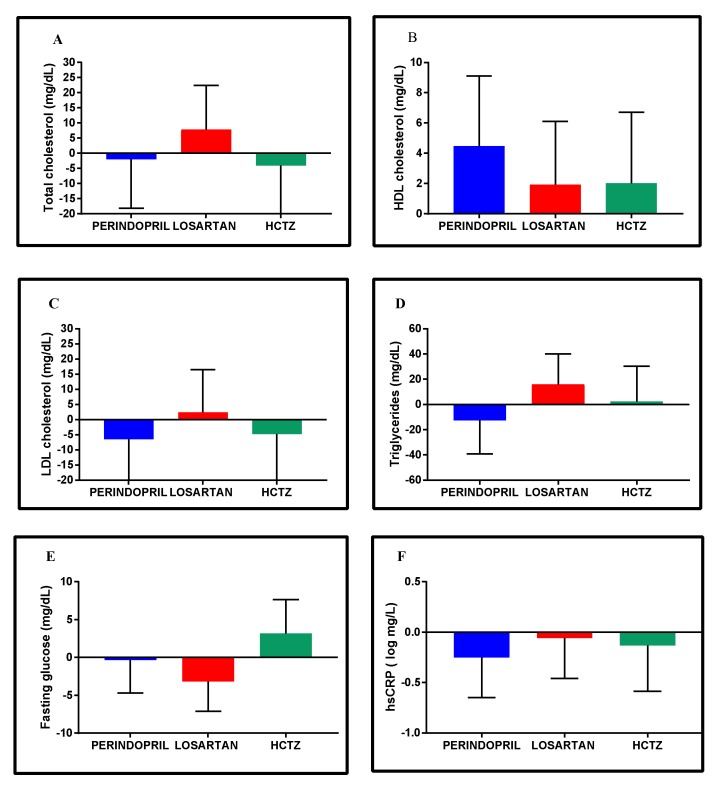
Figure 5.
Adjusted mean change within groups in lipid (A–D) and fasting glucose profiles (E) and in high-sensitivity C-reactive protein (F) from baseline to 24-week follow-up. Data are expressed as adjusted mean change within groups with 95% confidence intervals adjusted to age, sex, and baseline status. HDL cholesterol: High-density lipoprotein cholesterol; hsCRP: High-sensitivity C-reactive protein; LDL cholesterol: Low-density lipoprotein cholesterol. Log-transformation was used to normalize data distribution (Shapiro–Wilks test, p < 0.05).

