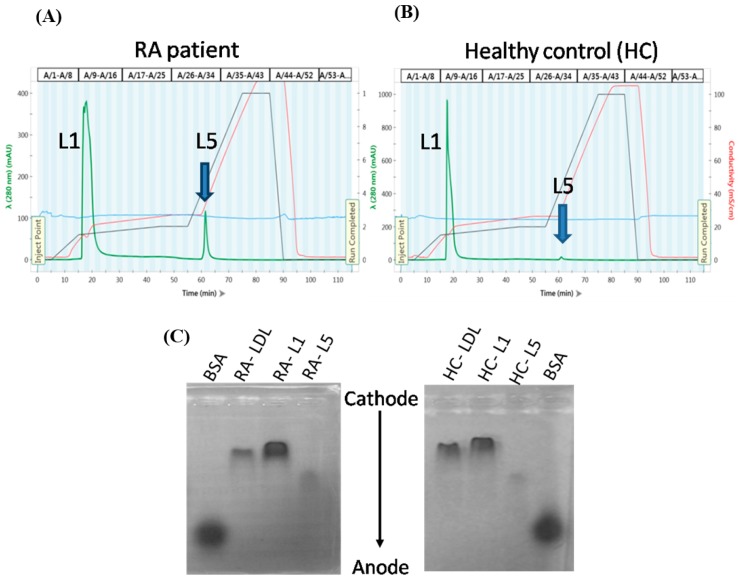
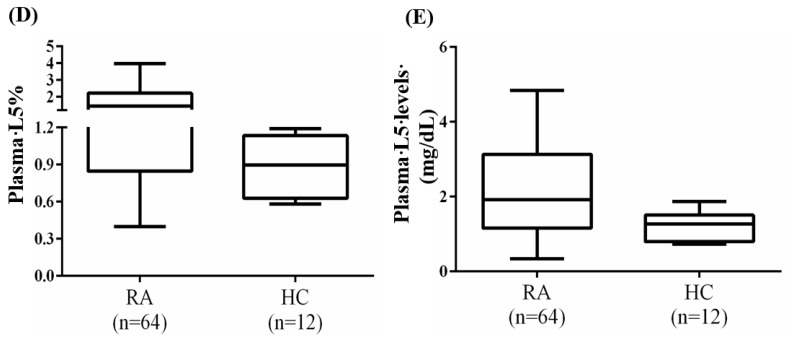
Figure 1.
Analysis of LDL subfractions L1 and L5 from RA patients and HC individuals. LDL subfractions L1 and L5 were eluted at the indicated time points according to electronegativity by using anion-exchange fast-protein liquid chromatography. Chromatograms are shown for a (A) RA patient and (B) healthy control individual. (C) LDL subfractions were subjected to agarose gel electrophoresis at 100 V for 2 h (BSA was used as a reference). Comparisons of plasma L5% (D) and L5 levels (E) between RA patients and healthy controls are shown. The data are presented as box-plot diagrams, in which the box encompasses the 25th percentile (lower bar) to the 75th percentile (upper bar). The horizontal line within the box indicates the median value for each group. BSA: Bovine serum albumin; HC: Healthy control; LDL: Low-density lipoprotein; RA: Rheumatoid arthritis. HC: Healthy control; RA: Rheumatoid arthritis. * p < 0.05 and ** p < 0.005 vs. HC, determined by using the nonparametric Mann-Whitney U test.


