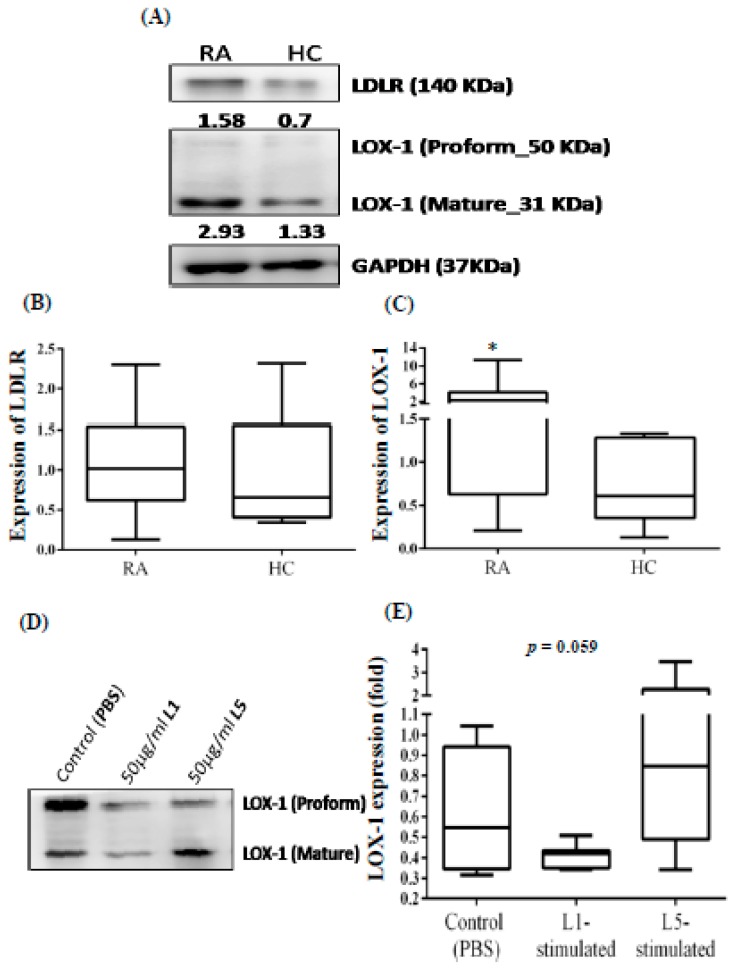
Figure 2.
Increased expression of LOX-1 in PBMCs of RA patients compared with HC individuals. Representative immunoblots showed (A) the expression of LDLR and the receptor for L5 (LOX-1) in the PBMCs of RA patients and healthy control individuals. Quantitative comparisons are shown for the expression of (B) LDLR and (C) LOX-1 in PBMCs between RA patients and HC individuals. (D) Representative immunoblots showing LOX-1 expression in the lysates of THP-1 cells treated with plasma L5 or L1. Quantitative comparison is shown for (E) LOX-1 expression in THP-1 cells treated with control (PBS), L5, or L1. The data are presented as box-plot diagrams, in which the box encompasses the 25th percentile (lower bar) to the 75th percentile (upper bar). The horizontal line within the box indicates the median value for each group. HC: Healthy control; LDLR: Low-density lipoprotein receptor; LOX-1: Lectin-like oxidized low-density lipoprotein receptor 1; PBMCs: Peripheral blood mononuclear cells; PBS: Phosphate-buffered saline; RA: Rheumatoid arthritis. * p < 0.05 vs. healthy control individuals, determined by using the nonparametric Mann-Whitney U test.

