Table 4.
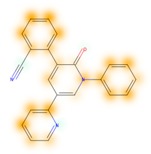
Examples of similarity maps generated by the NP classifier based on Morgan2 fingerprints.
| Similarity Map 1 | Name | Source 2 | NP Class Probability | Disease Indication | Year Introduced |
|---|---|---|---|---|---|
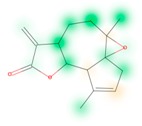
|
arglabin | N | 1.0 | anticancer | 1999 |
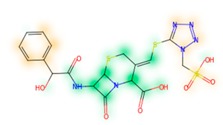
|
cefonicid sodium | ND | 0.34 | antibacterial | 1984 |
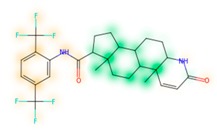
|
dutaseride | ND | 0.18 | benign prostatic hypertrophy | 2001 |
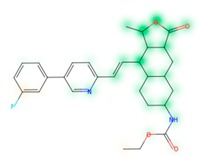
|
vorapaxar | ND | 0.30 | coronary artery disease | 2014 |
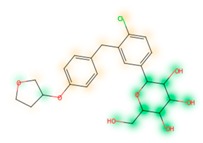
|
empagliflozin | S*/NM | 0.67 | antidiabetic (diabetes 2) | 2014 |

|
belinostat | S*/NM | 0.09 | anticancer | 2014 |
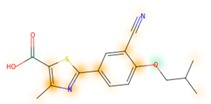
|
febuxostat | S/NM | 0.19 | hyperuricemia | 2009 |
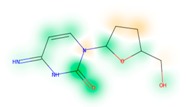
|
zalcitabine | S* | 0.46 | antiviral | 1992 |
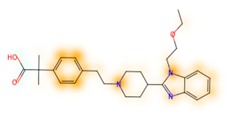
|
bilastine | S | 0.17 | antihistamine | 2011 |
|
perampanel | S | 0.16 | antiepileptic | 2012 |
1 Green highlights mark atoms contributing to the classification of a molecule as NP, whereas orange highlights mark atoms contributing to the classification of a molecule as SM. 2 N: Unaltered NP; ND: NP derivative; S*: Synthetic drug (NP pharmacophore); S: Synthetic drug; NM: Mimic of NP. Definitions according to ref [5].
