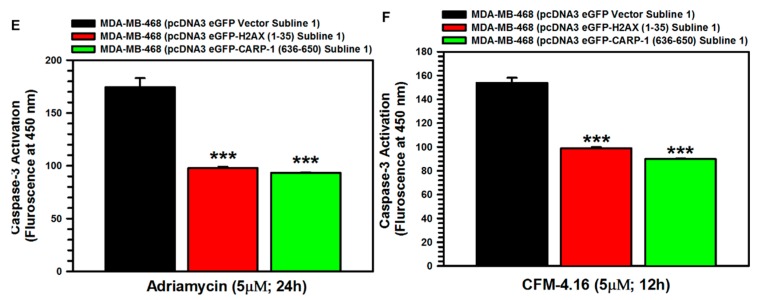
Figure 7.
Disruption of H2AX interaction with CARP-1 results in enhanced viabilities of CFM-4-, CFM-4.16-, or Adriamycin-treated cells in part due to reduced apoptosis. (A,C,D) Indicated MDA-MB-468 cell lines were treated with DMSO (Control), or with the noted dose and time of Adriamycin, CFM-4, or CFM-4.16 compounds. Determination of viable/live cells was carried out by MTT assay as described in Section 2. (B,E,F) Cell lysates derived from vehicle DMSO (Control), or CFM-4-, CFM-4.16-, or Adriamycin-treated cells were added to the wells that had immobilized fluorogenic substrates of noted caspases. The fluorescence released from the activated caspase-dependent cleavage of respective substrate was detected by a plate reader at the excitation and emission wavelengths of 380 nm and 460 nm, respectively, as detailed in Section 2. The columns in bar charts in panels A, C, D and B, D, F represent means of three and two independent experiments, respectively; bars, SE. For panels C and D, * p < 0.05, **p < 0.01 and *** p ≤ 0.001 relative to the respective EGFP vector subline. For panels E and F, *** p ≤ 0.05 relative to the respective EGFP vector subline.


