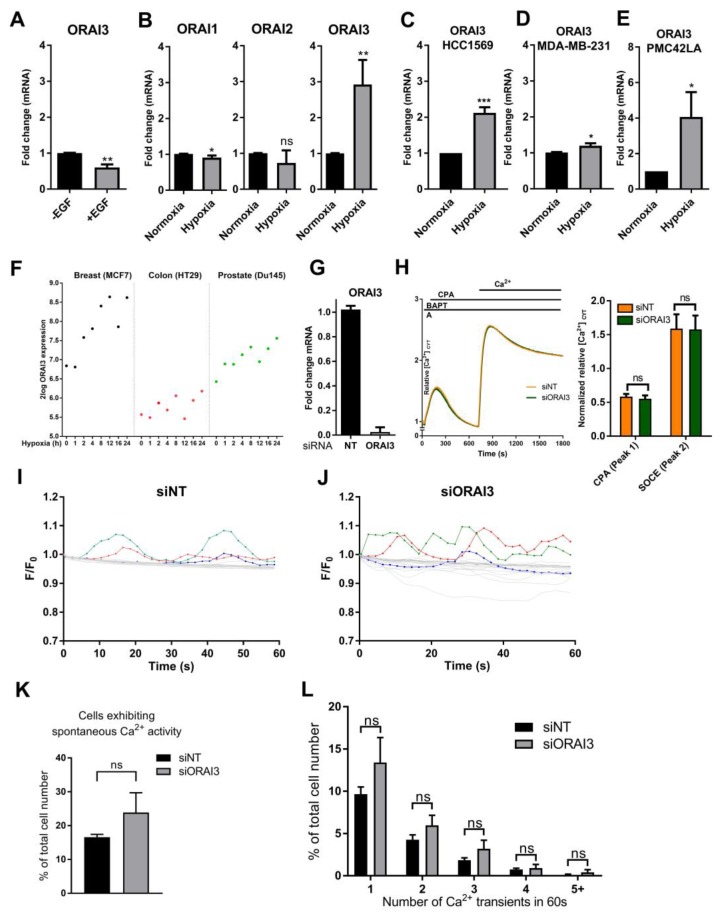
Figure 2.
Hypoxia induces ORAI3 expression. (A) ORAI3 expression after EGF treatment (24 h, 50 ng/mL) treatment in MDA-MB-468 cells (B) mRNA expression of ORAI1, ORAI2 and ORAI3 after hypoxia (24 h, 1% O2) in MDA-MB-468 breast cancer cells compared to cells maintained in normoxia. (C) Induction of ORAI3 expression after hypoxia (24 h) in HCC1569, (D) MDA-MB-231 and (E) PMC42LA breast cancer cells. (F) Assessment of ORAI3 expression in breast (MCF7), colon (HT29) and prostate (Du145) after exposure of cells to normoxia (time-point 0 h) and different times of severe hypoxia (0% O2 for 1, 2, 4, 8, 12, 16 and 24 h, respectively) extracted from the publicly available data [47] using the R2 genomics analysis platform. (G) confirmation of siRNA-mediated Orai3 silencing and (H) FLIPR traces (left) and quantification (right) of the mean [Ca2+]CYT levels during store-operated Ca2+ entry with ORAI3 silencing (siORAI3) and non-targeting siRNA control (siNT) in MDA-MB-468 cells exposed to 48 h hypoxia. (I) Spontaneous Ca2+ transients in MDA-MB-468 cells expressing GCaMP6m following ORAI3 silencing (siORAI3) and 48 h exposure to hypoxia. Ca2+ transients in 20 individual cells unbiasedly selected from a single well following silencing of non-targeted siRNA control (I), or ORAI3 (J). Highlighted lines represent examples of cells exhibiting spontaneous Ca2+ activity. (K) Percentage of cells exhibiting spontaneous Ca2+ activity. (L) Stratification of cells by number of Ca2+ transients in 60 s. ns = not significant (p ≥ 0.05), * p < 0.05, ** p < 0.01, *** p < 0.001 (unpaired t-test), n = 3, mean ± SD.

