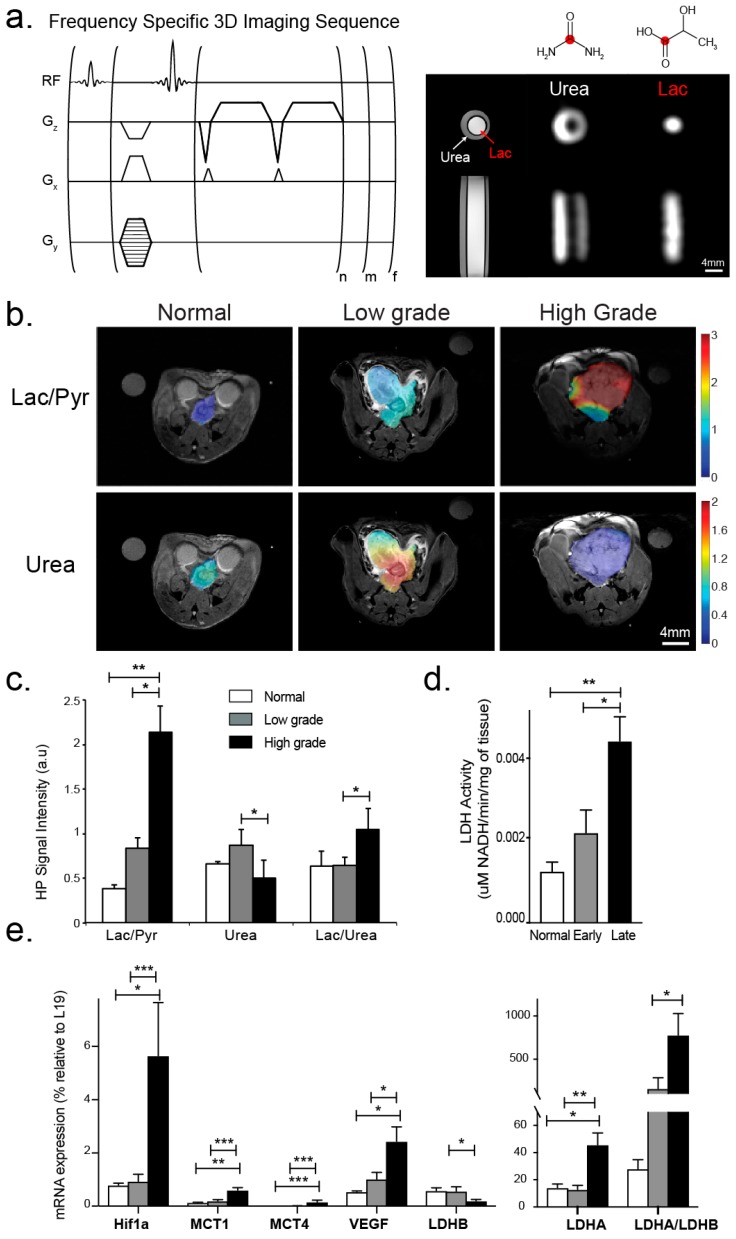
Figure 4.
(a) (top, left) Pulse sequence diagram of the high-spatial resolution 3D GRASE HP 13C MRSI imaging approach used for in vivo HP 13C imaging in this study (n and m number of phase encodes and f is the number of frequencies). (a) (top, right) Resonances of [1-13C] lactate, [1-13C] alanine [1-13C] pyruvate, and [13C] urea were excited and imaged sequentially as shown for the 13C lactate and 13C urea phantom. (b) Representative HP 13C Lac/Pyr and 13C-urea images overlaid on the corresponding T2-weighted anatomic images for the normal prostate, and low- and high-grade cancer. The color scale of the images represents the magnitude of the Lac/Pyr ratio. (c) Bar graph showing mean ± sdev values for Lac/Pyr, Urea/kidney Urea and Lac/Urea ratio from the normal mouse prostates and low and grade tumors studied. (d) Corresponding mean ± sdev LDH activity values. (e) Corresponding mean ± sdev mRNA expression values of key transporters and enzymes associated with pyruvate and lactate transport and metabolism (Mct1 and Mct4, Ldha and Ldhb) and of factors impacted by the hypoxic tumor microenvironment (Hif1α and Vegf). * denotes p < 0.05, ** for p < 0.005, *** for p < 0.0005.

