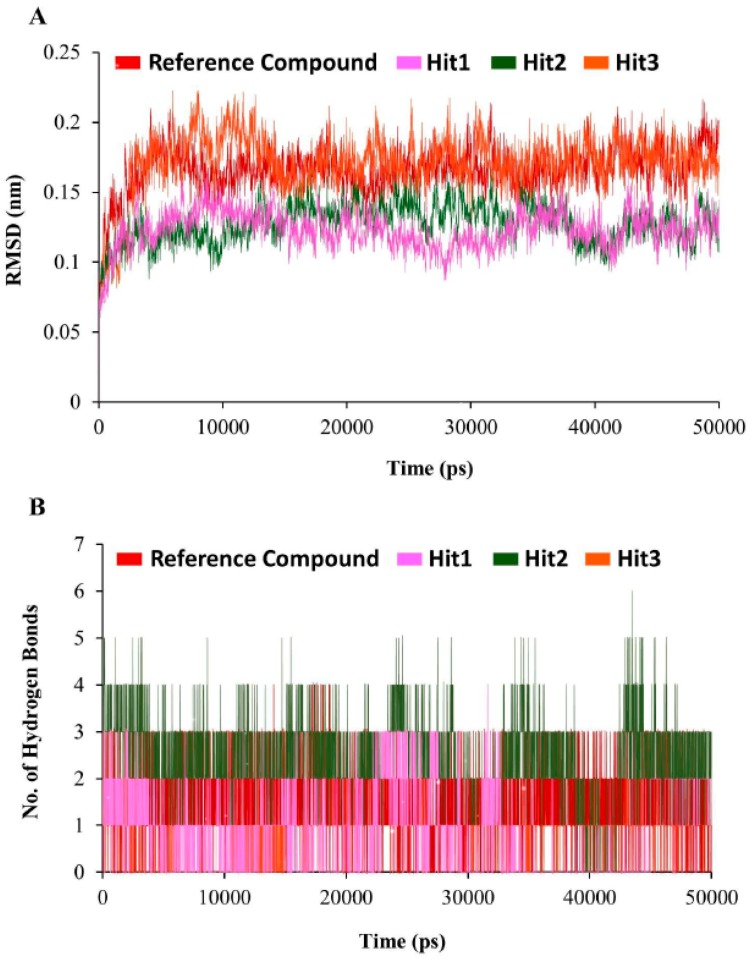
Figure 7.
Molecular dynamics simulation analyses. (A) The root mean square deviation (RMSD) profile of the backbone atoms of human dihydrofolate reductase (hDHFR). Each system suggested the stable RMSD during the entire simulation run. Color scheme is depicted as hDHFR in complex with reference compound (red), Hit1 (magenta), Hit2 (green), and Hit3 (orange). (B) The number of intermolecular hydrogen bonds between protein and compound during the 50 ns MD simulations. The reference compound, Hit1, Hit2, and Hit3 are displayed as red, magenta, green, and orange.

