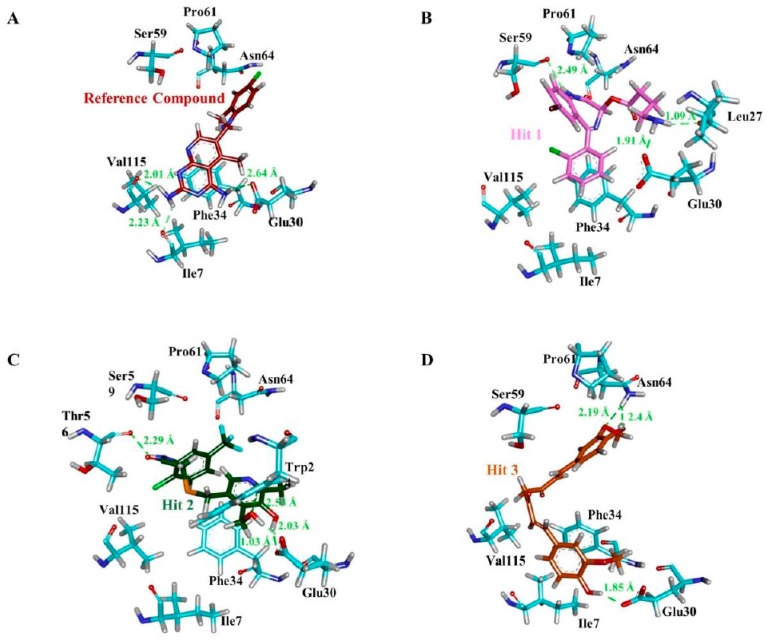
Figure 9.
Molecular interactions analyses. The reference compound and the three hit compounds interacted essential residues in the active site of hDHFR. The reference compound (A), Hit1 (B), Hit2 (C), and Hit3 (D) are depicted as a red, magenta, green, and orange colored stick representation. The H-bond forming residues of hDHFR are displayed as cyan stick model. H-bonding and bond distance are represented as green dashed lines and measured in angstrom (Å), respectively.

