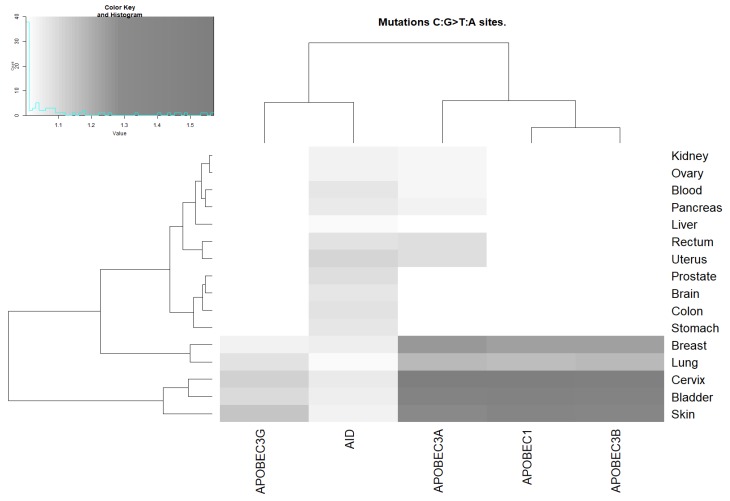
Figure 2.
Correlation between AID/APOBEC mutable motifs and the sequence context of somatic C:G>T:A mutations. For the actual data, see Supplementary Table S6. The intensities of the gray color correspond to the ratio values (the ratio being the mean weight of the mutated sites divided by the mean weight of the non-mutated sites). The unweighted pair group method with arithmetic mean (UPGMA) clustering of ratio values for the AID/APOBEC footprints and tissues is shown as dendrograms.

