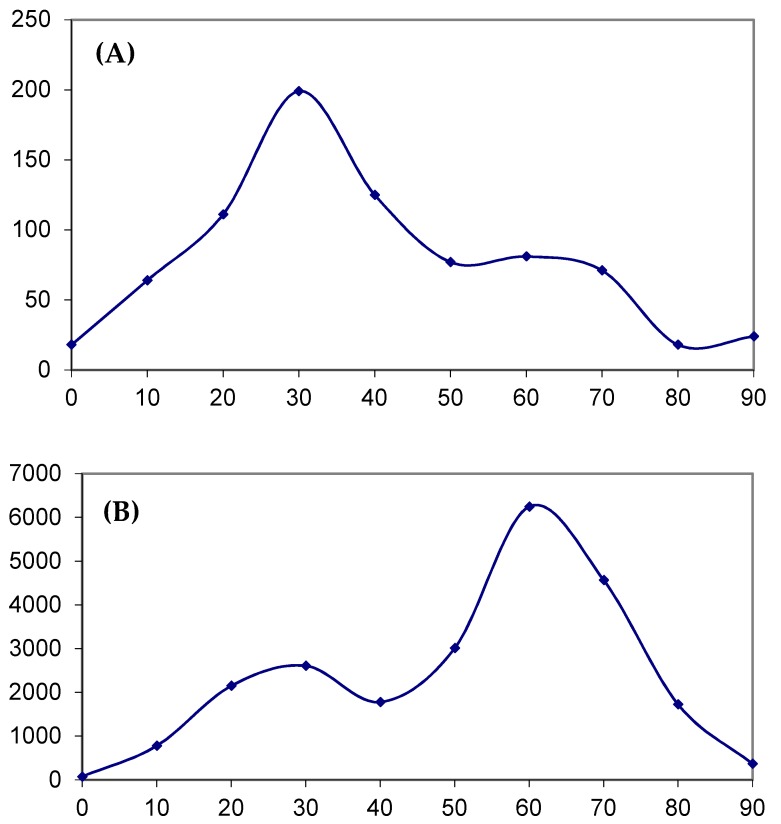
Figure 5.
The weight distribution obtained using (A) the APOBEC3G weight matrix for skin adenocarcinoma (Table 2) and (B) the APOBEC1 weight matrix for bladder tissue (Supplementary Table S6). X axis: 0 stands for 0–9 interval of weights, 1 stands for the 10–19 interval, 2 stands for 20–29, etc.

