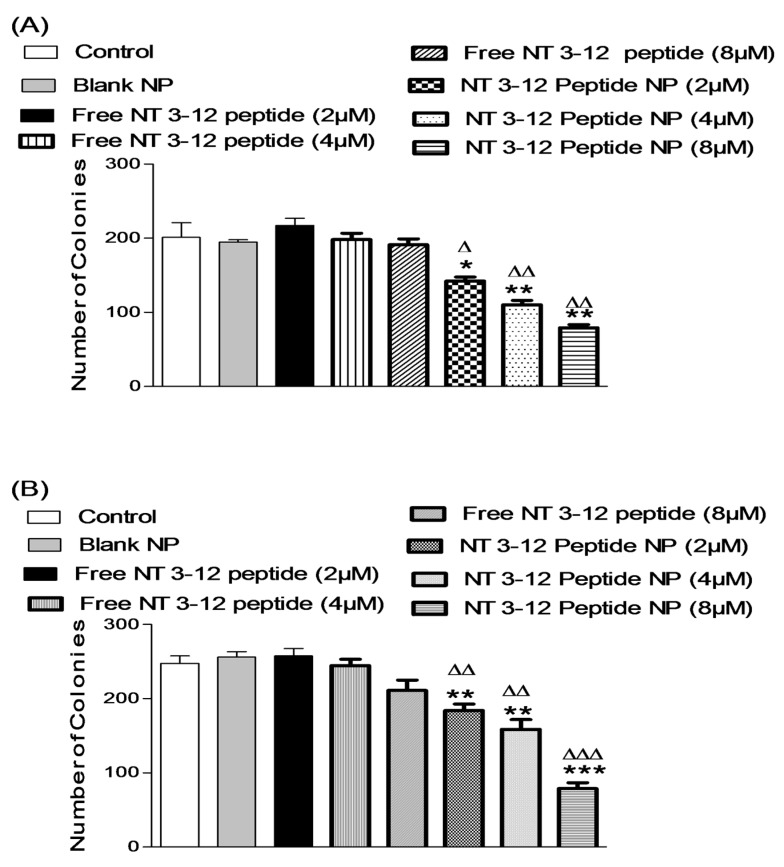
Figure 7.
Effect of different doses of free N 3–12 peptide and N 3–12 peptide-loaded NPs on MDA-MB-231 number of colonies (A) and A549 number of colonies (B). Values are mean ± SEM with n = 3. * p < 0.05, ** p < 0.01, *** p < 0.001 compared with Control and blank NP. Δ p < 0.05, ΔΔ p < 0.01, ΔΔΔ p < 0.001 compared with the same dose of free peptide.

