Figure 9.
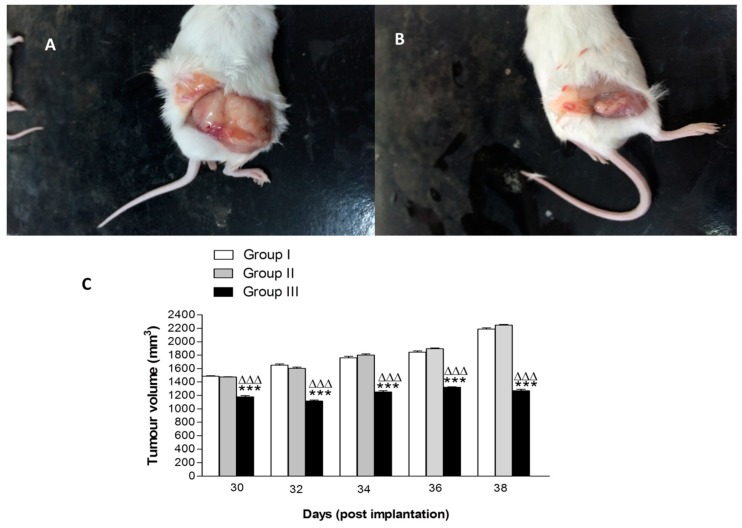
Effect of treatment with free N 3–12 peptide and N 3–12 peptide-loaded NPs on tumour volume in SEC mice. Photograph of Group II treated with free peptide (A) and photograph of Group III treated with N 3–12 peptide-loaded NPs (B). Tumor volume of groups at the recording points every 2 days from Day 12 (start point of treatment) to the last record at Day 38 post-implantation (C). For 9C, values are mean ± SEM with n = 10. *** p < 0.001 compared with Group I (control group). ΔΔΔ p < 0.001 compared with Group II (treated by free peptide 10 mg/kg).

