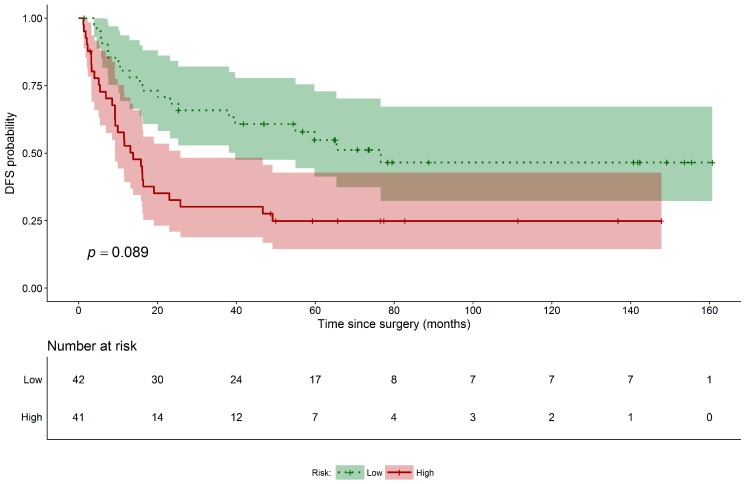
Figure 1.
DFS Kaplan–Meier curves for SCC patients. Disease-free survival risk table and leave-one-out cross-validated Kaplan–Meier curves for SCC high (red solid line) and low risk (green dotted line) patients groups along with their 95% confidence interval (accordingly shaded areas); permutated log-rank p-value for the hypothesis testing of equality of curves between groups is also reported.

