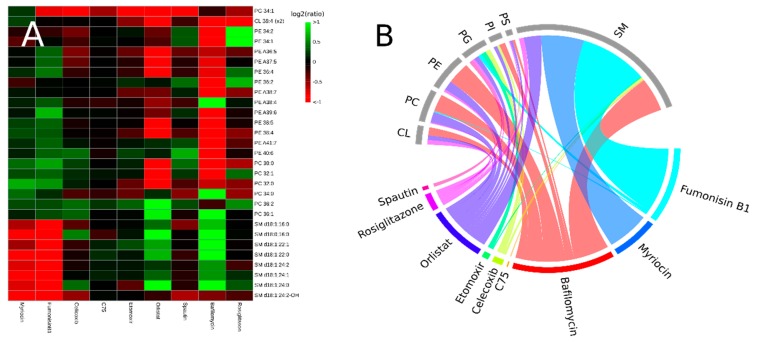
Figure 3.
Correlations between inhibitors and lipid species, and connections between inhibitors and lipid classes. (A) A heatmap of lipids species that at least contribute to 0.5% of the lipidome of the control samples, and that are changed at least by a factor 2 (up or down) with a p < 0.001. (B) A chord diagram showing connections between inhibitors and lipid classes, the width of the chords is determined the number of lipid species that significantly (p < 0.001) changed upon addition of the inhibitor.

